
An analysis of NMDFC Micro-Finance scheme
By Kashif-ul-Huda, TwoCircles.net,
Indian bureaucracy has a strange fascination for numbers. Success is measured in the quantum of money spent under a scheme rather than the effectiveness or impact of that scheme on the lives of beneficiaries. As a result, government reports also include number of beneficiaries served, as if more people under an ineffective scheme will correct the poorly-designed schemes.
But then, who are we to question the effectiveness of the schemes? Those, for whom the schemes are meant, are hardly ever consulted.
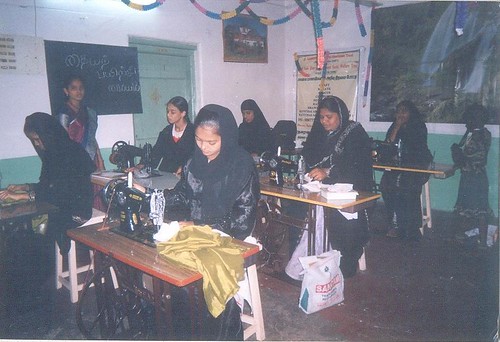
Vocational training center run by Salem’s Muslim Women’s Aid Society (file photo)
A quick scan through the sparse data released by the government and doing some basic analysis, it is evident that these schemes are not run uniformly all over the country. A case in point is the data released on Wednesday, December 10 regarding the National Minorities Development and Finance Corporation (NMDFC) micro-finance scheme.
This mirco-finance scheme was launched in 1998 to “reach the poorest among the target group, especially the minority women scattered in remote villages and urban slums who are not able to take advantage of the formal banking credit.”
According to the Ministry of Minority Affairs website, “Under this scheme small loans up to a maximum of Rs 25,000 per beneficiary are provided through the network of NGOs and SHGs.
Starting with a mere Rs 0.43 crore and 3,281 beneficiaries, it has grown to Rs 186.7 crore in the last financial year. Number of beneficiaries in the year 2010-11 topped at 129,742. In terms of benefit vis-à-vis funds per beneficiary, it has increased from mere Rs 706 in 1999-2000 to Rs 22,501 in the last financial year.
So far so good, except it is not free money. Money is disbursed through State Channelising Agencies (SCAs), which are NGOs nominated by state governments (political backscratching anyone?). Funds are transferred by NMDFC at 1% interest rate to SCAs, which then loans the amount to beneficiaries or through Self-Help Groups at the rate of 5%.
Some of these NGOs have poor track record. In fact in 2009, the NMFDC reports had shown 51 NGOs were facing lawsuits by NMFDC to recover over Rs 1.8 crore.
Now, an analysis of current data shows that until 2010-11 the amount per beneficiary was Rs 7,999 (which is way lower than maximum Rs 25,000 that can be loaned under this scheme). To boost the number per beneficiary, government dropped the number of beneficiaries. So from a high of 129,742 people being served under this scheme in 2010-11, there were 88,702 the very next year. This drop in people jumped the ‘per beneficiary’ rate from just under Rs 18,000 to over Rs 22,000.
This is not all. A look at state numbers shows Manipur with a rate of Rs 941/beneficiary at one end of the spectrum and Chhattisgarh at Rs 22,449/beneficiary at the other end. Majority of the states fall below the national average of Rs12,635/beneficiary. States such as Kerala and West Bengal with large number of beneficiaries skew the average, otherwise it will be very pathetic.
So here is a scheme that looks like working well on paper, but even a slight analysis exposes the problems in its implementation. It is anybody’s guess what a social audit, say, by reporters or activists will result into?
The state-wise details of amount disbursed and beneficiaries covered under the micro-finance scheme (MFS) since starting of the scheme in 1998 till 31.10.2014 are enlisted:
Table 1: State-wise list
|
State |
Disbursement (Rs. Lakhs) |
Number of Beneficiaries Assisted |
Amount/Beneficiary |
|
Andhra Pradesh |
669.39 |
21,871 |
3060.63 |
|
Arunachal Pradesh |
2.25 |
42 |
5357.14 |
|
Assam |
515.42 |
7,713 |
6682.48 |
|
Bihar |
120.29 |
6,084 |
1977.15 |
|
Chhattisgarh |
150 |
667 |
22488.76 |
|
Delhi |
72.8 |
611 |
11914.89 |
|
Gujarat |
145.5 |
1,769 |
8224.99 |
|
Haryana |
710.52 |
5,965 |
11911.48 |
|
Jammu & Kashmir |
282.72 |
3,078 |
9185.19 |
|
Jharkhand |
35.19 |
456 |
7717.11 |
|
Kerala |
17,566.76 |
130020 |
13510.81 |
|
Karnataka |
335.02 |
4315 |
7764.08 |
|
Maharashtra |
500.79 |
5,313 |
9425.75 |
|
Manipur |
16.61 |
1765 |
941.08 |
|
Madhya Pradesh |
115.31 |
1379 |
8361.86 |
|
Meghalaya |
3.6 |
62 |
5806.45 |
|
Mizoram |
9.81 |
123 |
7975.61 |
|
Nagaland |
1,236.51 |
7,306 |
16924.58 |
|
Orissa |
234.3 |
4,213 |
5561.36 |
|
Pudducherry |
210 |
1,417 |
14820.04 |
|
Rajasthan |
65.26 |
3,003 |
2173.16 |
|
Tamilnadu |
10,809.70 |
106370 |
10162.36 |
|
Tripura |
5 |
50 |
10000.00 |
|
Uttar Pradesh |
217.67 |
9,718 |
2239.86 |
|
Uttaranchal |
19.93 |
1,130 |
1763.72 |
|
West Bengal |
40,656.15 |
266786 |
15239.24 |
|
Total |
74,706.34 |
591226 |
12635.83 |
Table 2: Year-wise list
|
Year |
Amount disbursed(In Rs. Crores) |
No. of Beneficiaries |
Amount/beneficiary |
|
1998-99 |
0.43 |
3,281 |
1310.576044 |
|
1999-00 |
0.52 |
7,359 |
706.617747 |
|
2000-01 |
1 |
11,418 |
875.8101244 |
|
2001-02 |
4.78 |
24,529 |
1948.713767 |
|
2002-03 |
2.9 |
7,540 |
3846.153846 |
|
2003-04 |
4.42 |
9,415 |
4694.636219 |
|
2004-05 |
8.29 |
11,034 |
7513.1412 |
|
2005-06 |
10.01 |
10893 |
9189.38768 |
|
2006-07 |
13.17 |
25482 |
5168.354132 |
|
2007-08 |
13.22 |
16159 |
8181.199332 |
|
2008-09 |
15.93 |
16213 |
9825.448714 |
|
2009-10 |
58.73 |
73702 |
7968.576158 |
|
2010-11 |
103.79 |
129742 |
7999.722526 |
|
2011-12 |
159.38 |
88702 |
17968.02778 |
|
2012-13 |
186.7 |
82974 |
22501.02442 |
|
2013-14 |
122.96 |
54648 |
22500.36598 |
|
Total |
706.22 |
573095 |
12322.9133 |
Related: