
The Myth Of The Muslim Population Bomb
There has been a notable decline in the decadal population growth of Muslims. In 1991-2001, the Muslim population increased by 29 percent, whereas in 2001-11, the increase was only 24 percent, though it is still much higher than the average national decadal population growth of 18 percent. But if the Muslim population growth is closely analysed, one will find that the trend of having small families is on the rise. Spread of education among Muslims will subsequently slow down the population rise.
Myth 1
Muslim women produce 10 children
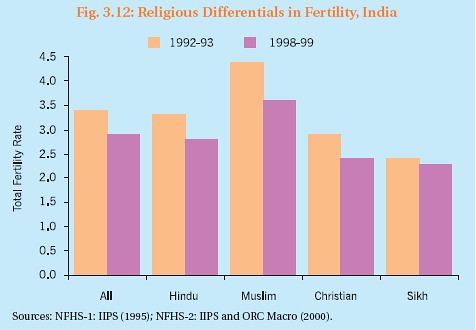
The data collected by the National Family Health Survey (NFHS) is a blow to the propaganda spread by the Hindutva brigade. The three surveys were conducted in 1991-92, 1998-99 and 2005-06. We can easily view the change in fertility rate and major trends of family planning and use of contraception during the past 15 years.
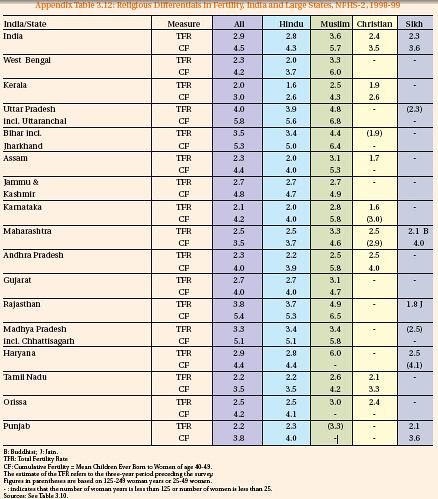
In 1991-92, the total fertility rate or TFR (the number of children a woman produces in her child-bearing age) of Hindu women was 3.3, while it was 4.41 for Muslim women. In 1998-99, it came down to 2.78 for Hindus and 3.59 for Muslims. In 2005-06, the TFR of Hindu women was recorded at 2.59, while for Muslim women it was 3.4. Clearly, there has been a steady decrease in the fertility rate of Muslim women during the past 15 years.
Myth 2
Muslims are against family planning
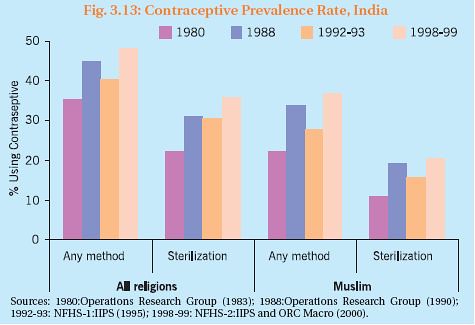
However, data collected in the NFHS reveal that Muslim women are readily acquiring modern methods of contraception such as condom, IUD, pill, sterilisation, etc. In fact, there has been a rise in the incidence of such usage.
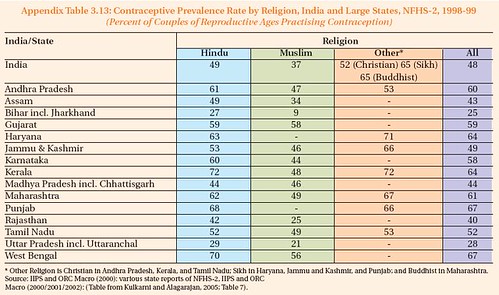
The following table compares the trend among Hindu and Muslim women acquiring modern methods of contraception.
Clearly, there is a rising awareness among Muslim women about contraception though they still lag behind Hindu women in terms of family planning. However, while the use of modern contraceptive methods among Hindu women increased from 37.7 percent in NFHS-1 to 44.3 percent in NFHS-2, going up by 6.6 percentage points, among Muslim women this figure went up from 22 percent in NFHS-1 to 30.2 percent in NFHS-2, an increase of 8.2 percentage points.
Similarly, the increase in the use of contraception among Hindu women was 5.9 percentage points between NFHS-2 and NFHS-3, while it was 6.2 percentage points for Muslim women, 0.3 percentage points more than the Hindu women. According to NFHS-3, 21.3 percent Muslim women and 39.9 percent Hindu women underwent sterilisation.
Myth 3
Polygamy is leading to a spike in Muslim population
According to recent figures, the sex ratio among Muslims is 936:1,000; i.e., for every 1000 males, there are 936 females. It means 64 Muslim males in every 1,000 will remain unmarried. Now, if some Muslim men practise polygamy, it would decrease the number of women further and as many more men would have to stay single because the number of women is less.
Polygamy can lead to an increase in population only if women outnumber men. Let us understand it with an example. Suppose 100 out of every 1,000 Muslim men wish to take a second wife. In that case, 1,100 women are needed. But the number of women is only 936, which means only 836 men will be able to marry, while the rest 164 will remain single. Hence, this belief that the practice of polygamy among Muslims is causing their population to rise is false. It would be possible only if the sex ratio were skewed in favour of women, which is not the case.
Full report:
The Myth Of The Muslim Population Bomb
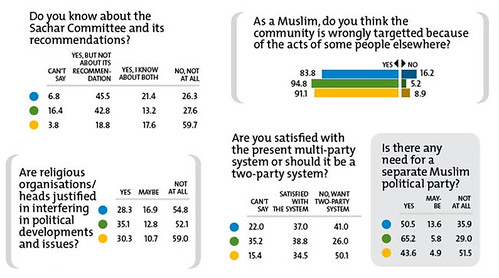
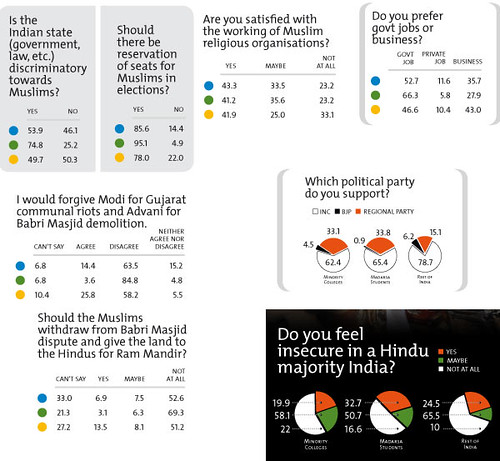
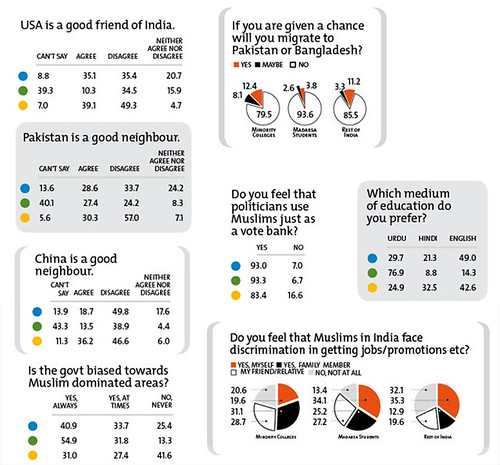
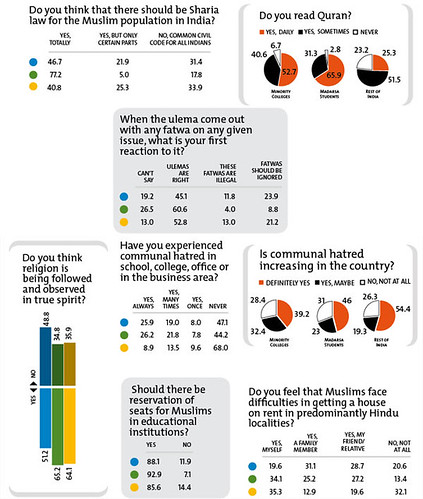
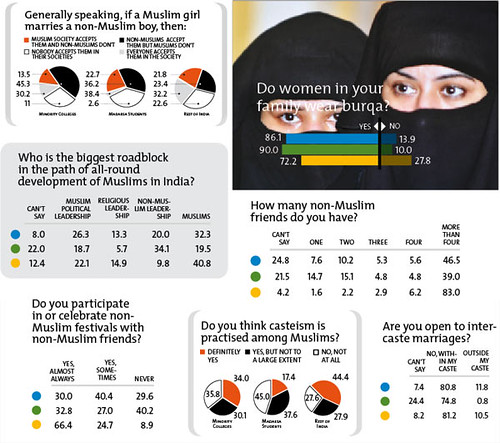
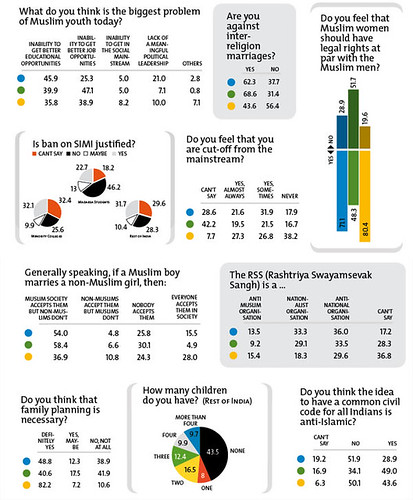
This survey was conducted across three segments of Muslims – students of minority institutions, students of madrasas and the rest of the community. Respondents from minority colleges are denoted by a blue dot, those from madrasas by a green dot and the rest of India by a yellow dot.
Source: Thesundayindian.com
http://www.thesundayindian.com/article.php?category_id=7&article_id=10780#
Muslim representation in Police Force

Source: The Telegraph
http://www.telegraphindia.com/1100510/jsp/frontpage/story_12431527.jsp
Data related to Indian Muslim from Sachar Report
Distribution of Population of each Religion by Caste Categories
|
Religion |
SCs |
STs |
OBCs |
Others |
|
Hindu |
22.2 |
9.1 |
42.8 |
26.0 |
|
Muslim |
0.8 |
0.5 |
39.2 |
59.5 |
|
Christians
|
9.0 |
32.8 |
24.8 |
33.3 |
|
Sikhs
|
30.7 |
0.9 |
22.4 |
46.1 |
|
Jains
|
0.0 |
2.6 |
3.0 |
94.3 |
|
Buddhists
|
89.5 |
7.4 |
0.4 |
2.7 |
|
Zoroastrians
|
0.0 |
15.9 |
13.7 |
70.4 |
|
Others
|
2.6 |
82.5 |
6.2 |
8.7 |
|
Total |
19.7 |
8.5 |
41.1 |
30.8 |
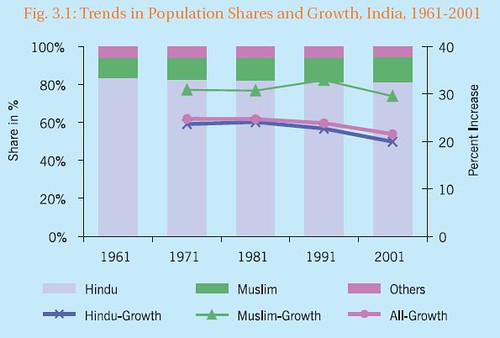
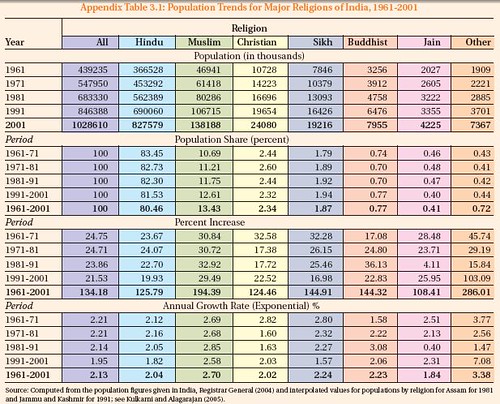
Trends in Population Shares and Growth, India, 1961-2001
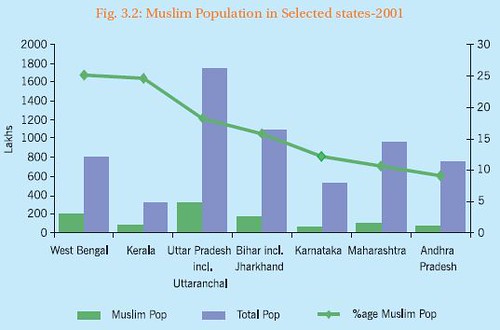
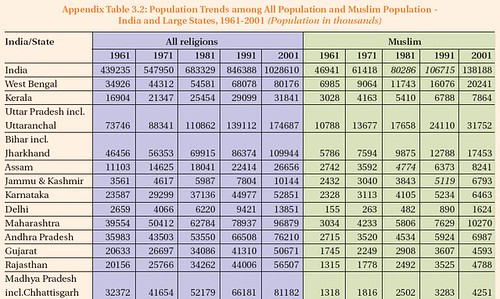
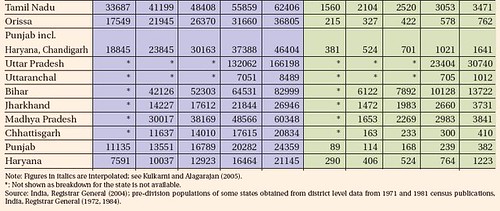
Muslim Population in Selected states-2001
No. of Districts by Muslim Population Size and Concentration, 2001 Census
|
Muslim Population in the |
Number of districts |
Percentage of Muslims in |
Number of districts
|
|
1,000,000 or more |
25 |
75 or more |
9 |
|
500,000 to 999,999 |
51 |
50 or more but less than 75 |
11 |
|
250,000 to 499,999 |
104 |
25 or more but less than 50 |
38
|
|
100,000 to 249,999 |
125 |
10 or more but less than 25 |
182
|
|
50,000 to 99,999 |
87 |
5 or more but less than 10 |
129
|
|
10,000 to 49,999 |
95 |
1 or more but less than 5 |
147 |
|
Less than 10,000 |
106 |
Less than 1 |
77 |
|
Total |
593 |
Total |
593
|
Age-Sex Distribution of All Population and Muslim Population, India, 2001 (Percentage)
|
Age Group |
All religious |
Muslim |
||
|
Male |
Female |
Male |
Female |
|
|
0-4 |
10.7 |
10.7 |
12.4 |
12.7 |
|
5-9 |
12.5 |
12.4 |
14.7 |
14.7 |
|
10-14 |
12.3 |
11.9 |
14.0 |
13.7 |
|
15-19 |
10.1 |
9.3 |
10.8 |
10.1 |
|
20-24 |
8.7 |
8.8 |
8.7 |
8.6 |
|
25-29 |
7.8 |
8.4 |
7.2 |
7.8 |
|
30-34 |
7.0 |
7.4 |
6.3 |
6.7 |
|
35-39 |
6.8 |
7.0 |
6.1 |
6.3 |
|
40-44 |
5.6 |
5.2 |
4.9 |
4.5 |
|
45-49 |
4.7 |
4.5 |
3.9 |
3.8 |
|
50-54 |
3.7 |
3.4 |
3.1 |
2.7 |
|
55-59 |
2.6 |
2.8 |
2.0 |
2.3 |
|
60-64 |
2.6 |
2.8 |
2.1 |
2.2 |
|
65 |
4.5 |
5.0 |
3.5 |
3.8 |
|
Age |
0.3 |
0.2 |
0.3 |
0.2 |
|
Total |
100.0 |
100.0 |
100.0 |
100.0 |
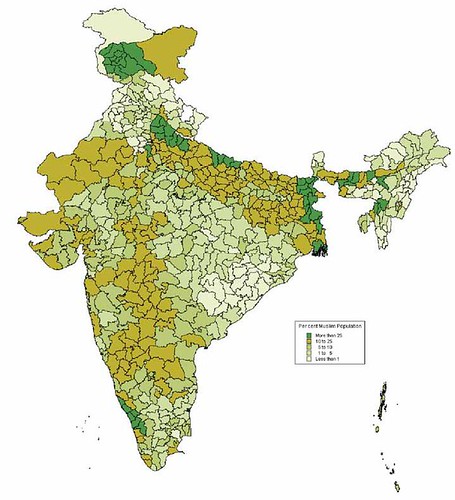
District-wise Concentration of Muslim Population
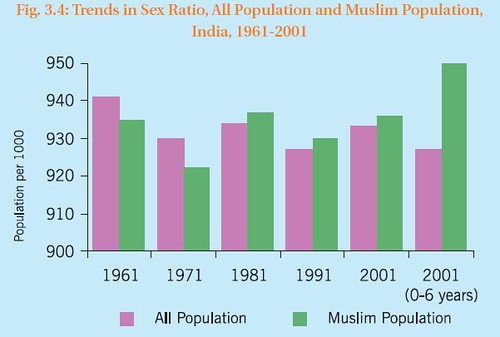
Trends in Sex Ratio, All Population and Muslim Population, India, 1961-2001
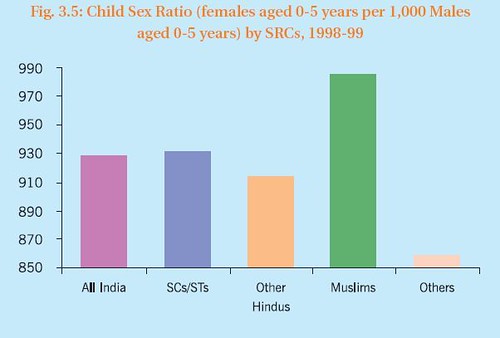
Child Sex Ratio (females aged 0-5 years per 1,000 Males aged 0-5 years) by SRCs, 1998-99
Child Sex Ratio (females aged 0-5 years per 1,000 males aged 0-5 years) among SRCs by region, 1998-99

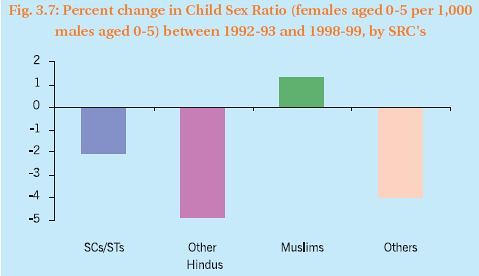
Percent change in Child Sex Ratio (females aged 0-5 per 1,000 males aged 0-5) between 1992-93 and 1998-99, by SRC’s
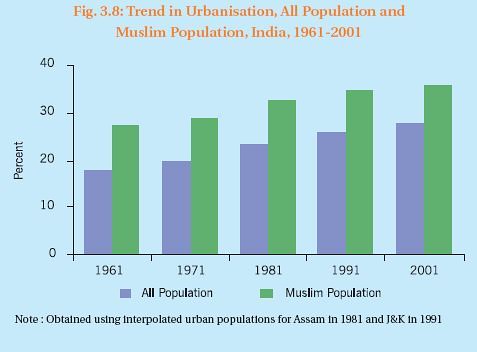
Trend in Urbanisation, All Population and Muslim Population, India, 1961-2001
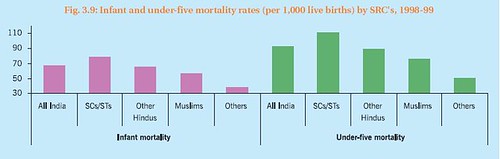
Infant and under-five mortality rates (per 1,000 live births) by SRC’s, 1998-99
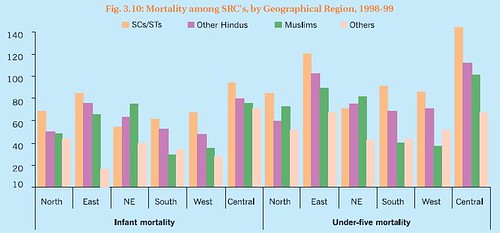
Mortality among SRC’s, by Geographical Region, 1998-99
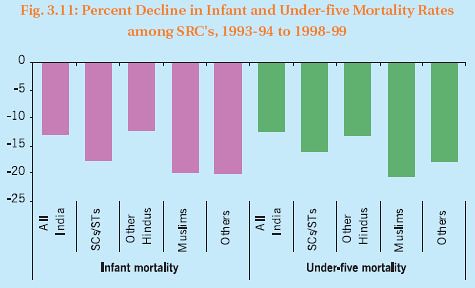
Percent Decline in Infant and Under-five Mortality Rates among SRC’s, 1993-94 to 1998-99
Religious Differentials in Fertility, India
Contraceptive Prevalence Rate, India
Large States Classified according to Level of Fertility and Share of Muslim Population,India, NFHS-2
|
Level of fertility |
Range |
All |
Muslim |
|
Moderately High |
Greater than 4.0 but Less than/equal to 5.0 |
|
Rajasthan, Uttar Pradesh, Bihar |
|
Moderate |
Greater than 3.0 but Less than/equal to 4.0 |
Uttar Pradesh, Rajasthan, Bihar, Madhya Pradesh |
INDIA, Madhya Pradesh, West Bengal, Maharashtra, |
|
Moderately Low |
Greater |
INDIA, |
Karnataka, |
|
Low |
Less than/equal to 2.2 |
Tamil Nadu, Karnataka, Kerala |
|
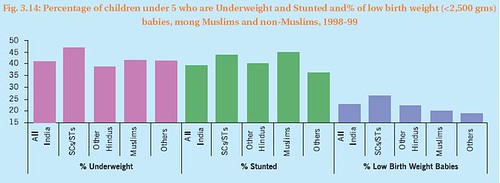
Percentage of children under 5 who are Underweight and Stunted and% of low birth weight (<2,500 gms) babies, mong Muslims and non-Muslims, 1998-99
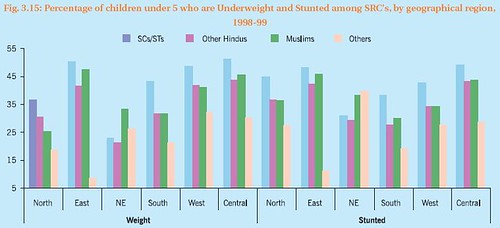
Percentage of children under 5 who are Underweight and Stunted among SRC’s, by geographical region, 1998-99
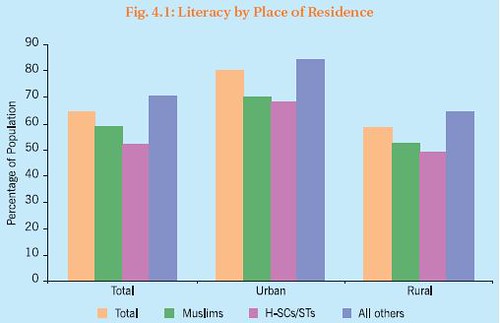
Literacy by Place of Residence
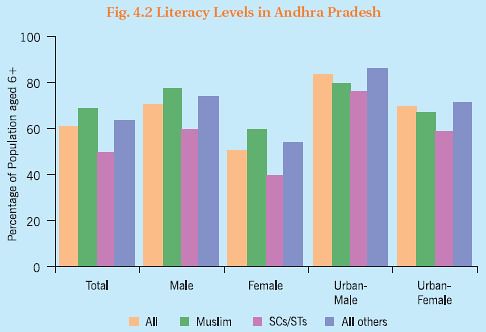
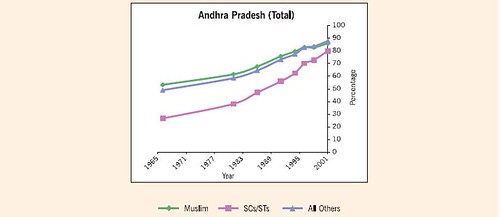
Literacy Levels in Andhra Pradesh
Literates as Proportion of Population by Age Groups – 2004-05
|
Age Group |
Hindus |
Muslims |
Other Minorities |
||
|
Gen |
OBC |
SCs/STs |
|||
|
6-13 years |
90.2 |
80.8 |
74.7 |
74.6 |
88.5 |
|
14-15 years |
95.7 |
87.5 |
80.0 |
79.5 |
91.9 |
|
16-17 years |
95.0 |
85.2 |
78.6 |
75.5 |
91.3 |
|
18-22 years |
91.4 |
76.9 |
65.0 |
70.5 |
85.8 |
|
23 years & above |
74.0 |
50.6 |
36.5 |
46.1 |
67.0 |
|
Total |
80.5 |
63.4 |
52.7 |
59.9 |
75.2 |
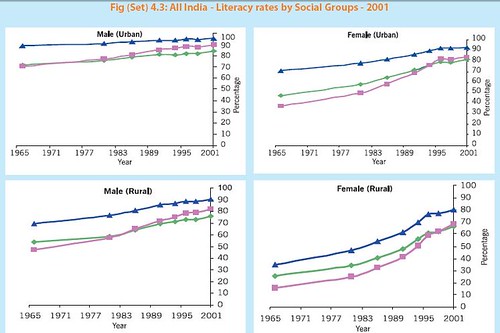
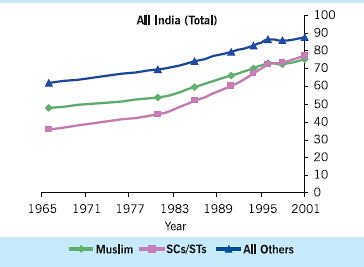
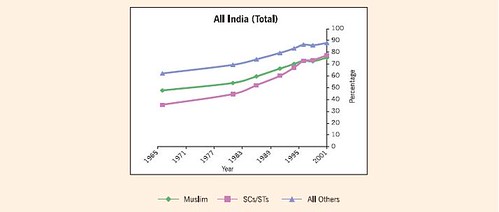
All India – Literacy rates by Social Groups – 2001
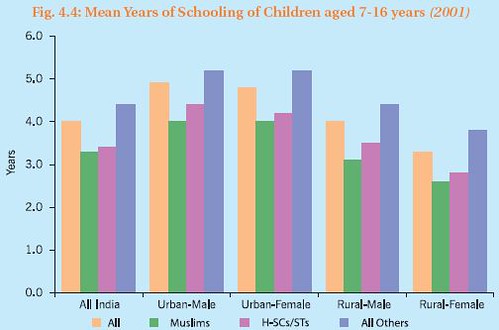
Mean Years of Schooling of Children aged 7-16 years (2001)
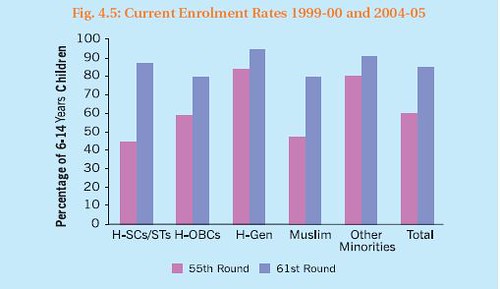
Current Enrolment Rates 1999-00 and 2004-05
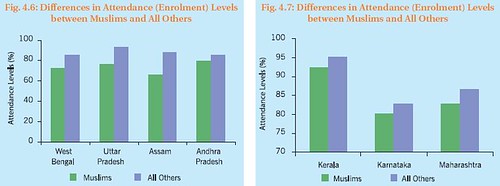
Differences in Attendance (Enrolment) Levels between Muslims and All Others
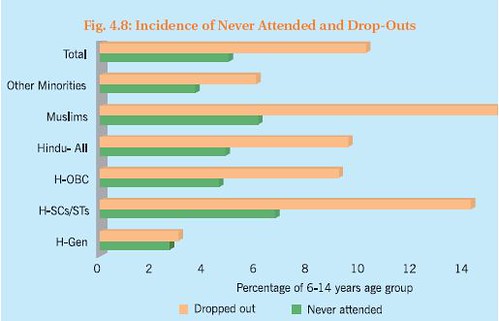
Incidence of Never Attended and Drop-Outs
Percentage Attainment Levels in SRCs

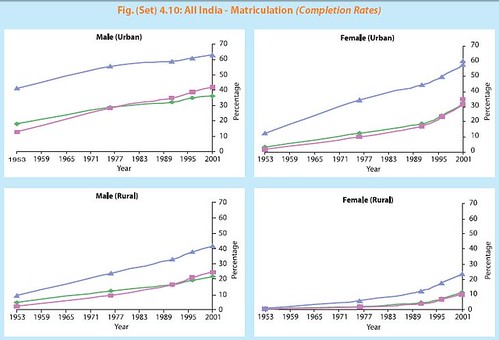
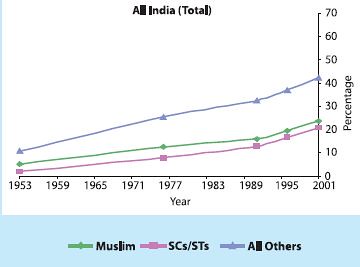
All India – Matriculation (Completion Rates)
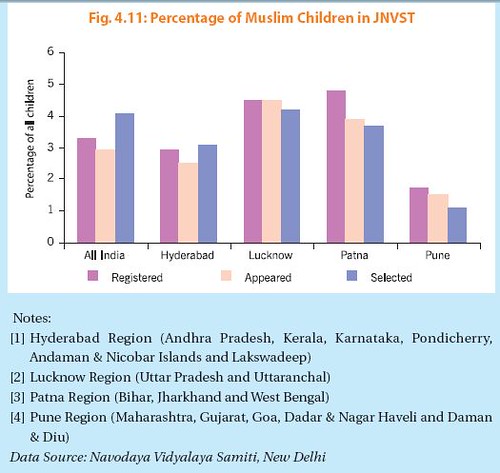
Percentage of Muslim Children in JNVST
Graduates and Diploma Holders by SRCs
|
SRCs |
Number (in lakhs) |
Percentage of 20 years+Population |
Distribution across SRCs |
|||
|
Graduates |
Diploma and Certificates |
Graduates |
Diploma and Certificates |
Graduates |
Diploma and Certificates |
|
|
Total |
376.7 |
40.5 |
6.7 |
0.7 |
100 |
100 |
|
Muslim |
23.9 |
2.7 |
3.6 |
0.4 |
6.3 |
6.8 |
|
SCs/STs |
30.8 |
4.1 |
2.4 |
0.3 |
8.2 |
10.2 |
|
All Others |
322 |
33.7 |
8.8 |
0.9 |
85.5 |
83.0 |
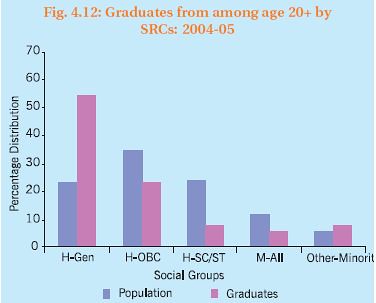
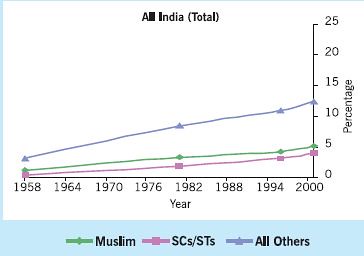
Graduates from among age 20+ by SRCs: 2004-05
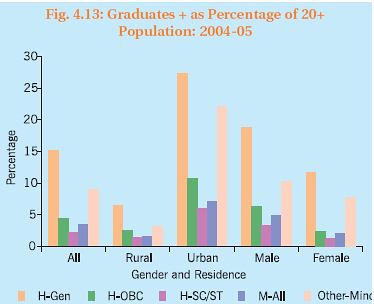
Graduates + as Percentage of 20+ Population: 2004-05
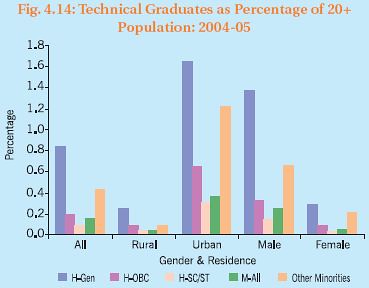
Technical Graduates as Percentage of 20+Population: 2004-05
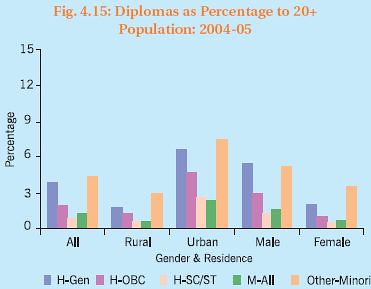
Diplomas as Percentage to 20+Population: 2004-05
All India – Graduation (Completion Rates)
Graduates as Proportion of Population by Age Groups – All India, 2004-05
|
Age Group |
Hindus |
Muslims |
Other Minorities |
||
|
Gen |
OBCs |
SCs/STs |
|||
|
20-30 years |
18.6 |
6.5 |
3.3 |
4.5 |
11.6 |
|
30-40 years |
16.8 |
4.6 |
2.3 |
3.3 |
9.2 |
|
40-50 years |
14.6 |
3.2 |
1.5 |
2.8 |
8.1 |
|
51 years & above |
9.8 |
1.9 |
0.9 |
2.1 |
5.7 |
|
Total |
15.3 |
4.4 |
2.2 |
3.4 |
8.9 |
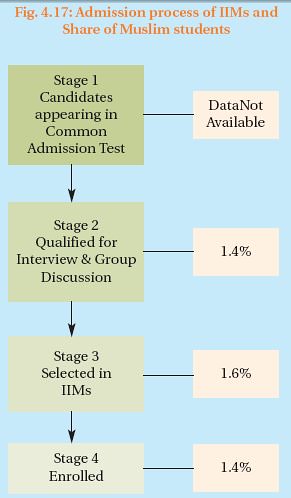
Admission process of IIMs and Share of Muslim students
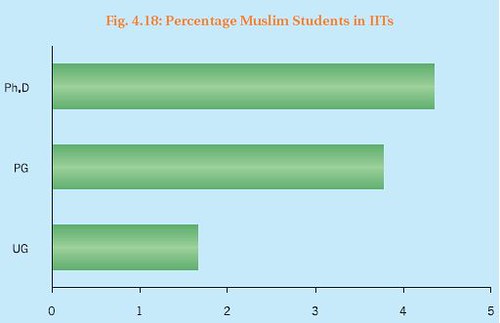
Percentage Muslim Students in IITs
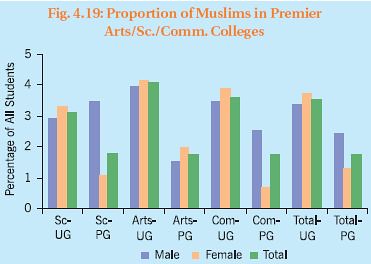
Proportion of Muslims in Premier Arts/Sc./Comm.Colleges
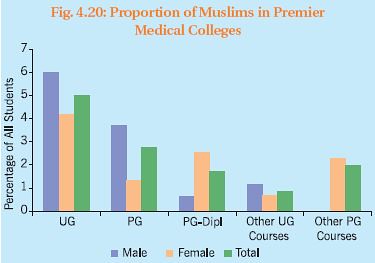
Proportion of Muslims in Premier Medical Colleges
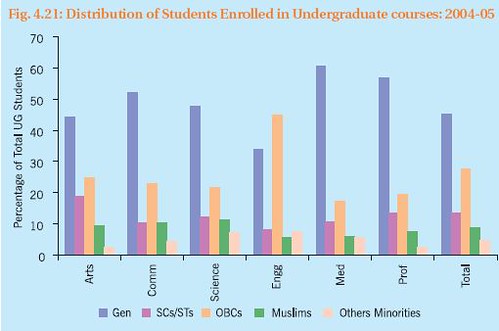
Distribution of Students Enrolled in Undergraduate courses: 2004-05
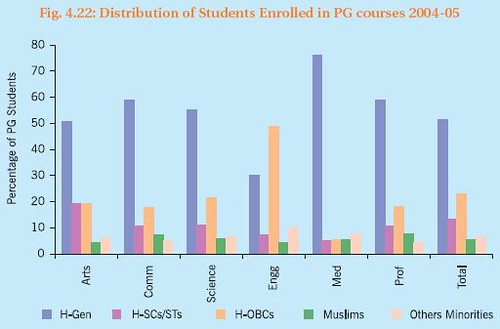
Distribution of Students Enrolled in PG courses 2004-05
Children Currently Studying as a Proportion of Population by Age Groups – 2004-05
|
Age Groups |
Hindus |
Muslims |
Other Minorities |
||
|
Gen |
OBCs |
SCs/STs |
|||
|
6-13 years |
19.1 (17.3) |
36.1 (35.5) |
25.7 (27.4) |
14.0 (15.1) |
5.1 (4.8) |
|
14-15 years |
24.3 (19.9) |
36.1 (35.2) |
21.4 (25.2) |
12.2 (14.5 |
6.0 (5.3) |
|
16-17 years |
28.9 (21.1) |
33.7 (35.0) |
20.2 (24.7) |
10.7 (14.0) |
6.3 (5.1) |
|
18-22 years |
34.0 (20.8) |
30.5 (34.4) |
17.7 (25.5) |
10.2 (13.9) |
7.6 (5.5) |
|
23 years & above |
35.6 (23.9) |
29.2 (35.1) |
18.3 (24.1) |
7.4 (10.9) |
9.5 (5.9) |
Incidence of Graduation and those Pursuing Post-Graduate Studies among Poor and non-Poor Households according to SRCs: 20-30 Age Group – 2004-05
|
SRCs |
20-30 years old persons |
Graduates |
Attending PG cources |
Unemployment Rates among Graduates |
||||
|
Percentage to population |
Distribution across SRCs |
Percentage of population in the age group |
Distribution across SRCs (SRCs) |
Percentage of graduates in the SRCs |
Distribution across SRCs |
|||
|
Non-Poor |
SCs/STs |
66.3 |
21.8 |
3.8 |
10.1 |
21.5 |
8.9 |
19.1 |
|
H-OBCs |
78.5 |
35.1 |
6.2 |
26.6 |
22.1 |
24.2 |
23.8 |
|
|
H-General |
89.2 |
25.5 |
15.7 |
48.9 |
26.6 |
53.4 |
20.5 |
|
|
Muslims |
71.2 |
11.4 |
4.9 |
6.8 |
22.9 |
6.4 |
25.6 |
|
|
All Minorities |
86.1 |
6.2 |
10.1 |
7.6 |
22.4 |
7.2 |
25.3 |
|
|
|
Total |
77.3 |
100 |
8.2 |
100 |
24.4 |
100 |
21.4 |
|
Poor |
SCs/STs |
33.7 |
37.7 |
0.8 |
17.4 |
27.6 |
19.6 |
9.8 |
|
H-OBCs |
33.7 |
32.7 |
1.7 |
30.8 |
23.0 |
29.0 |
16.2 |
|
|
H-General |
10.8 |
10.5 |
5.8 |
34.9 |
29.3 |
41.9 |
14.4 |
|
|
Muslims |
28.8 |
15.7 |
1.2 |
10.5 |
16.3 |
7.0 |
16.7 |
|
|
All Minorities |
13.9 |
3.4 |
3.4 |
6.4 |
9.5 |
2.5 |
17.4 |
|
|
|
Total |
22.7 |
100 |
1.8 |
100 |
24.4 |
100 |
12.7 |
Distribution of Enrolled Muslim Children aged 7-16 Years by Type of School

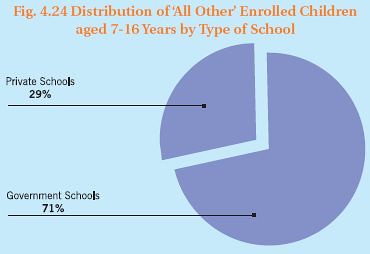
Distribution of ‘All Other’ Enrolled Children aged 7-16 Years by Type of School
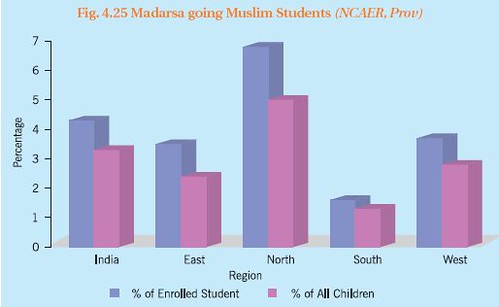
Madarsa going Muslim Students (NCAER,Prov)
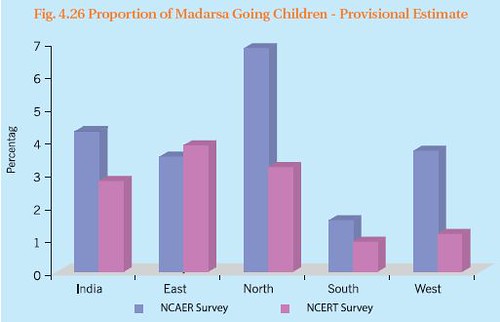
Proportion of Madarsa Going Children – Provisional Estimate
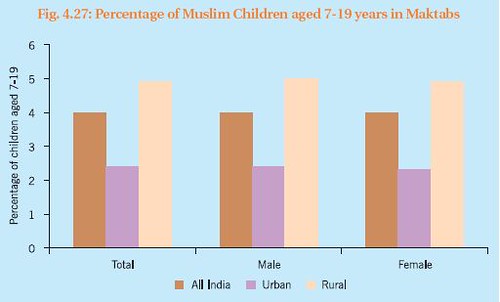
Percentage of Muslim Children aged 7-19 years in Maktabs
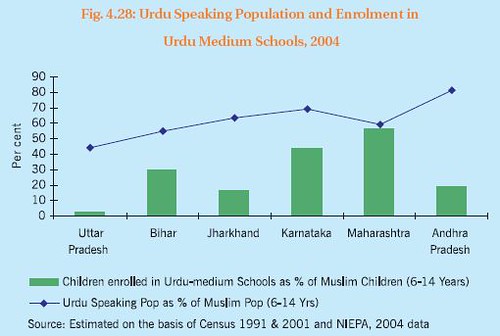
Urdu Speaking Population and Enrolment in Urdu Medium Schools, 2004
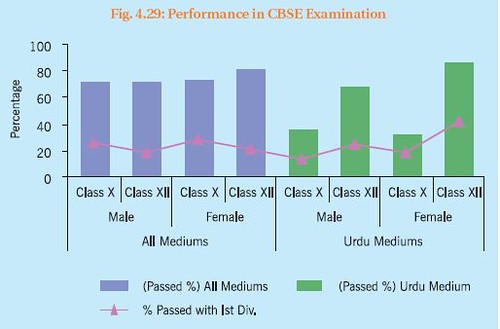
Performance in CBSE Examination
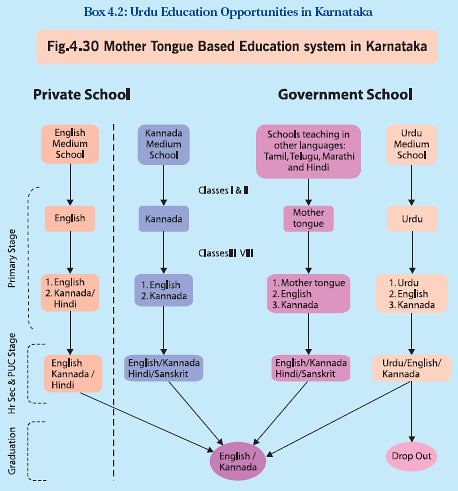
Urdu Education Opportunities in Karnataka
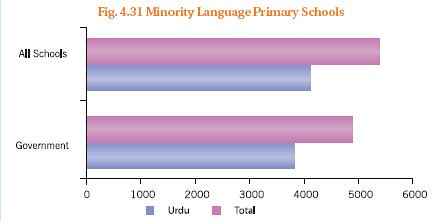
Minority Language Primary Schools
Teachers In Minority Language Primary Schools

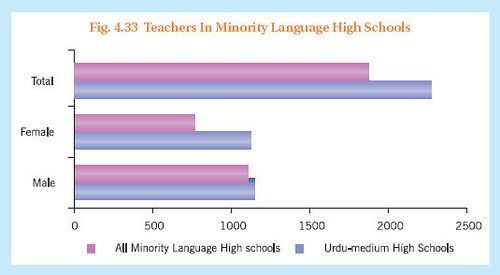
Teachers In Minority Language High Schools
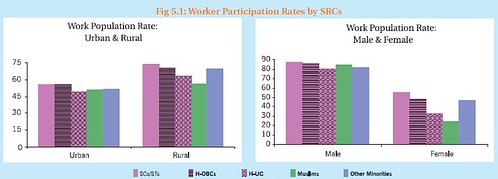
Worker Participation Rates by SRCs
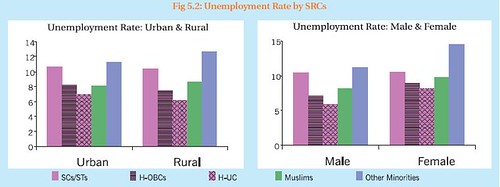
Unemployment Rate by SRCs
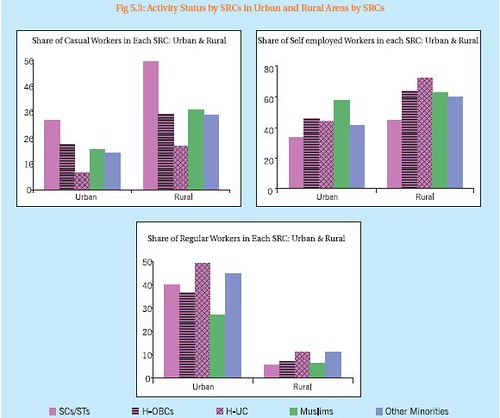
Activity Status by SRCs in Urban and Rural Areas by SRCs
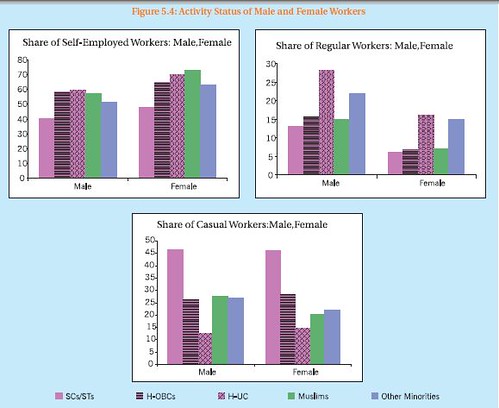
Activity Status of Male and Female Workers
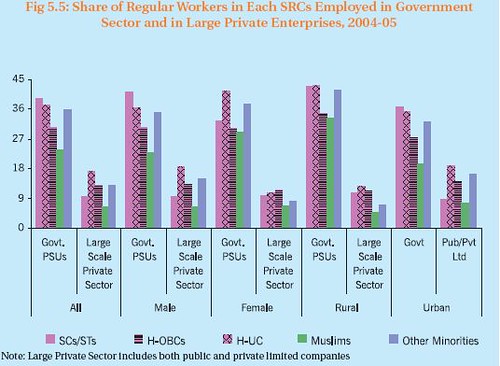
Share of Regular Workers in Each SRCs Employed in Government Sector and in Large Private Enterprises, 2004-05
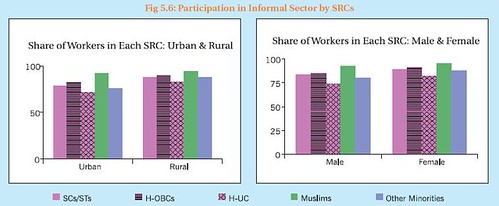
Participation in Informal Sector by SRCs
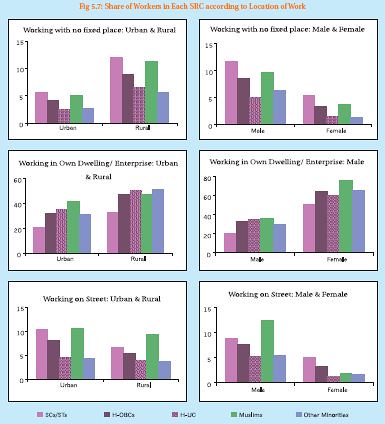
Share of Workers in Each SRC according to Location of Work
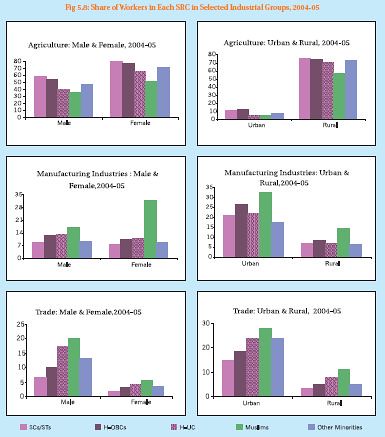
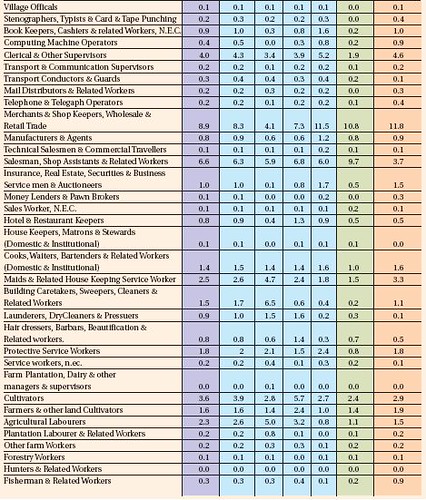
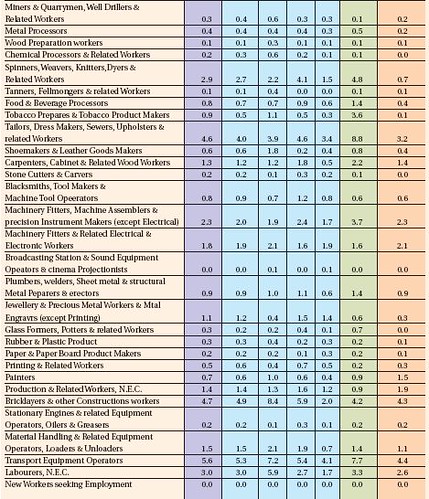
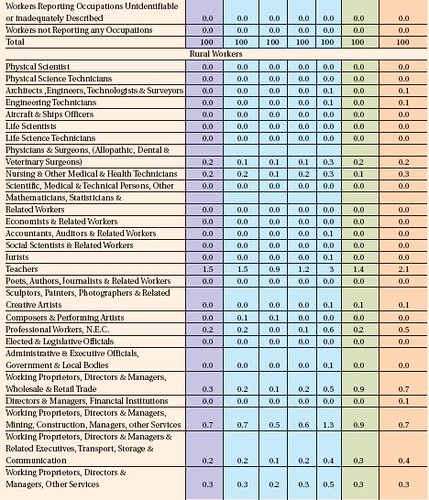
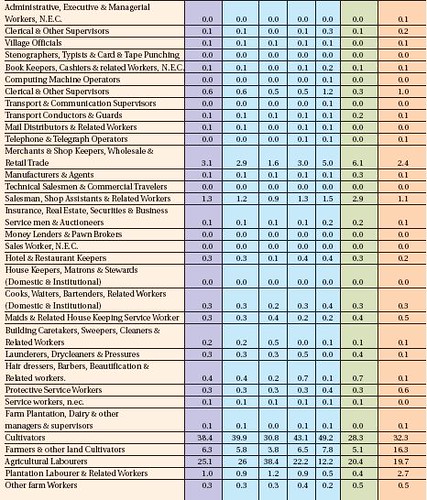
Share of Workers in Each SRC in Selected Industrial Groups, 2004-05
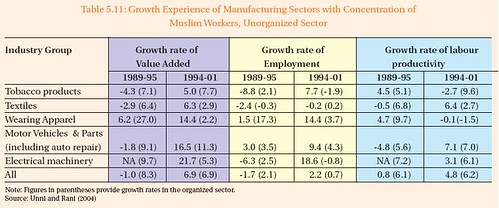
Growth Based Categorization of Industry Groups
|
Category A: Growth industries with good quality employment A1.Growing value added, employment and labour productivity A2.Growing value added and labour productivity but declining employment |
|
Category B: Growth industries with poor quality employment B1.Growing value added and employment but declining labour productivity B2.Growing value added but declining employment and labour productivity |
|
Category C: Non-growth industries C1.Growing employment but declining value added and labour productivity C2.Growing labour productivity but declining employment and value added C3.Declining value added, employment and labour productivity |
Growth Experience of Manufacturing Sectors with Concentration of Muslim Workers, Unorganized Sector
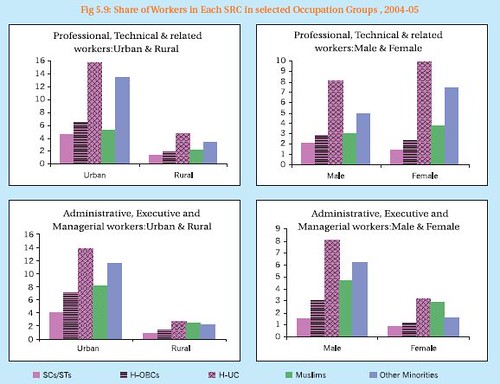
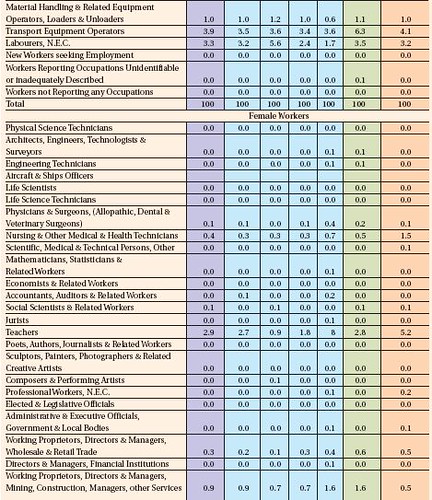
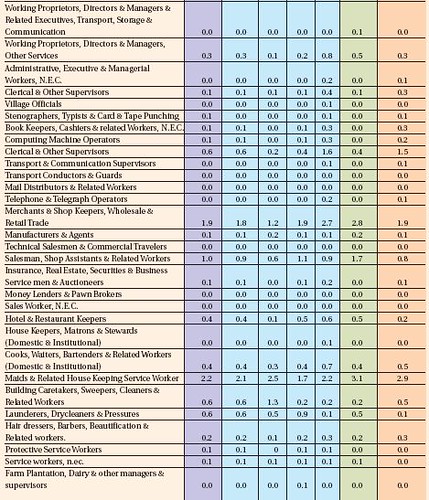
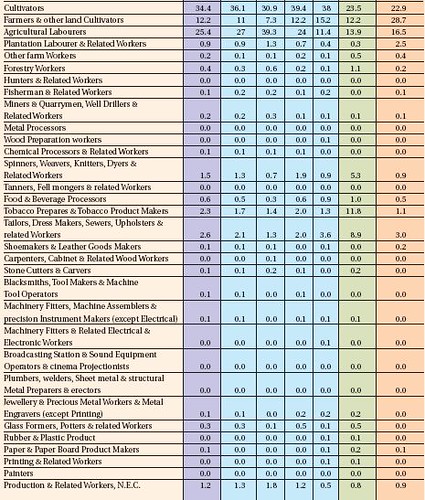
Share of Workers in Each SRC in selected Occupation Groups , 2004-05
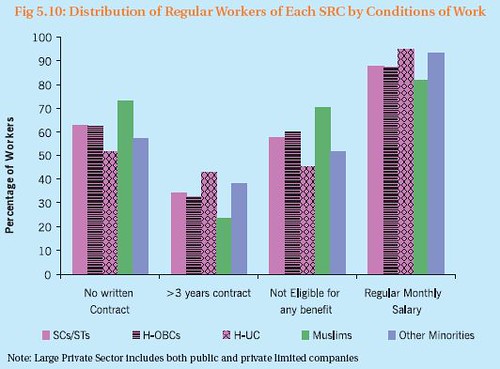
Distribution of Regular Workers of Each SRC by Conditions of Work
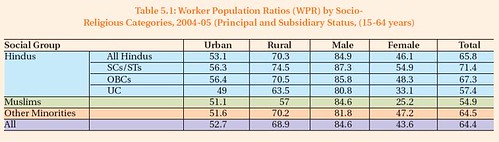
Worker Population Ratios (WPR) by Socio-Religious Categories, 2004-05 (Principal and Subsidiary Status, (15-64 years)
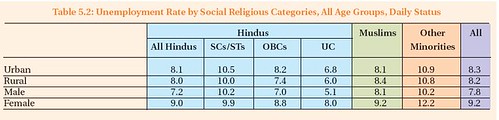
Unemployment Rate by Social Religious Categories, All Age Groups, Daily Status
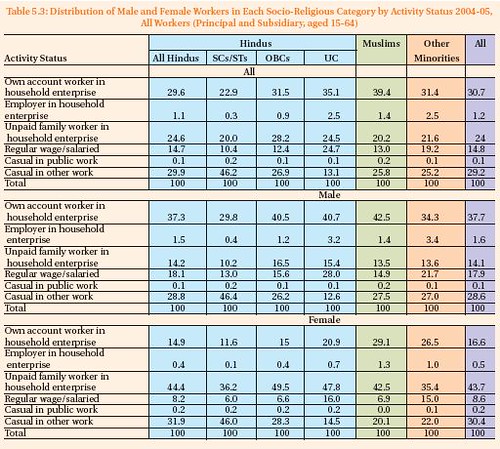
Distribution of Male and Female Workers in Each Socio-Religious Category by Activity Status 2004-05, All Workers (Principal and Subsidiary, aged 15-64)
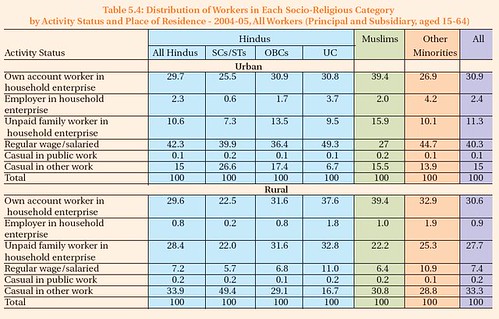
Distribution of Workers in Each Socio-Religious Category by Activity Status and Place of Residence – 2004-05, All Workers (Principal and Subsidiary, aged 15-64)
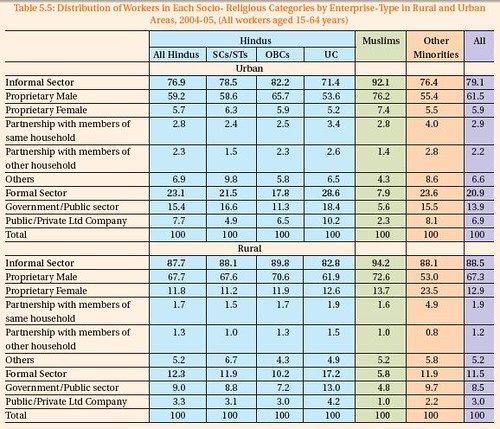
Distribution of Workers in Each Socio- Religious Categories by Enterprise-Type in Rural and Urban Areas, 2004-05, (All workers aged 15-64 years)
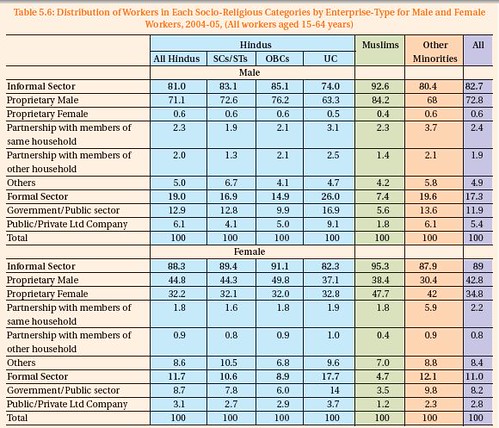
Distribution of Workers in Each Socio-Religious Categories by Enterprise-Type for Male and Female Workers, 2004-05, (All workers aged 15-64 years)
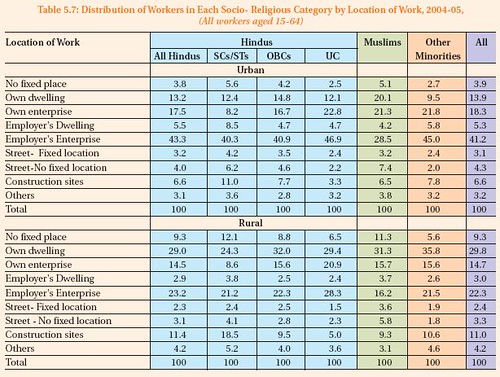
Distribution of Workers in Each Socio- Religious Category by Location of Work, 2004-05, (All workers aged 15-64)
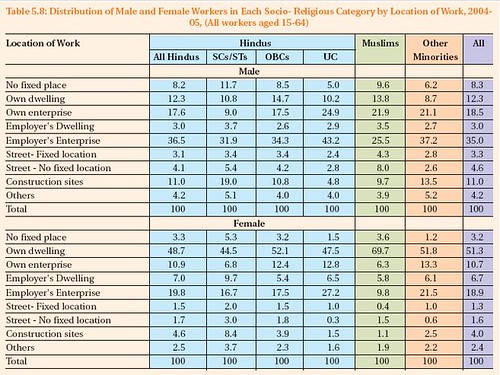
Distribution of Male and Female Workers in Each Socio- Religious Category by Location of Work, 2004-05, (All workers aged 15-64)
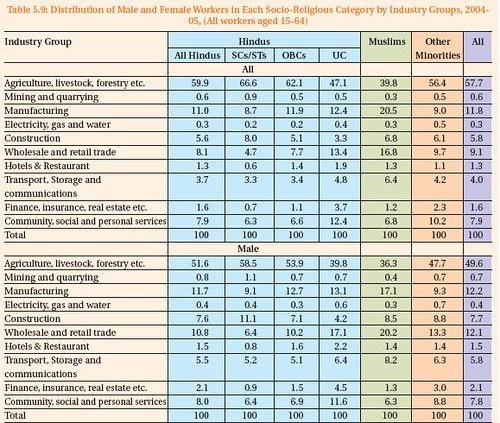
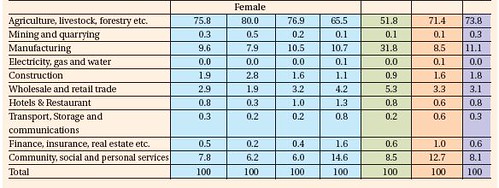
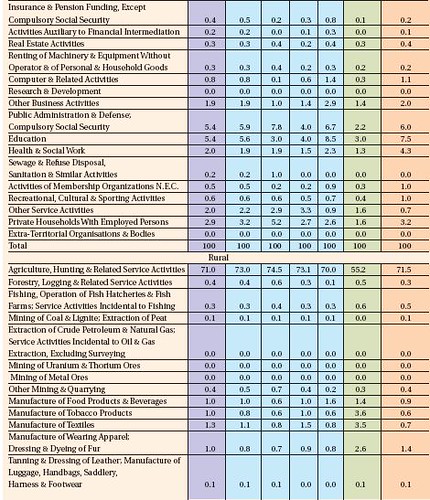
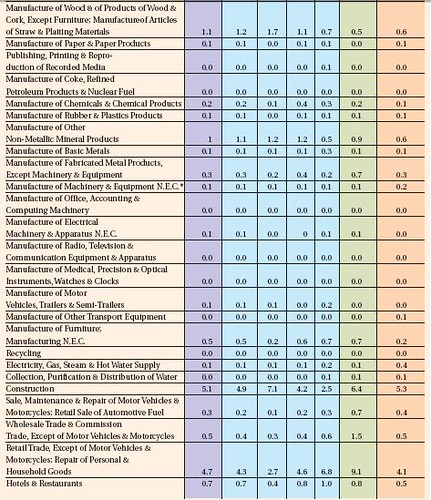
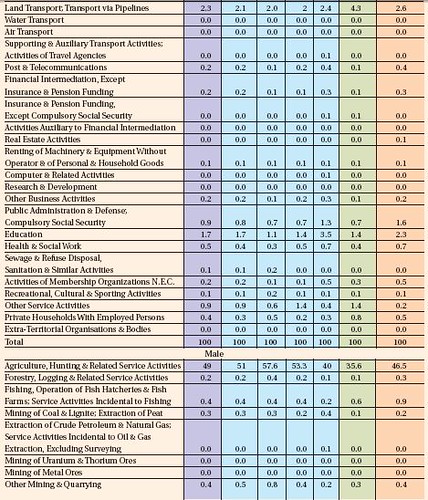
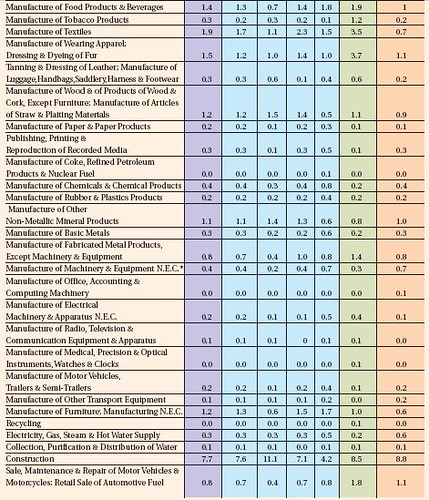
Distribution of Male and Female Workers in Each Socio-Religious Category by Industry Groups, 2004-05, (All workers aged 15-64)
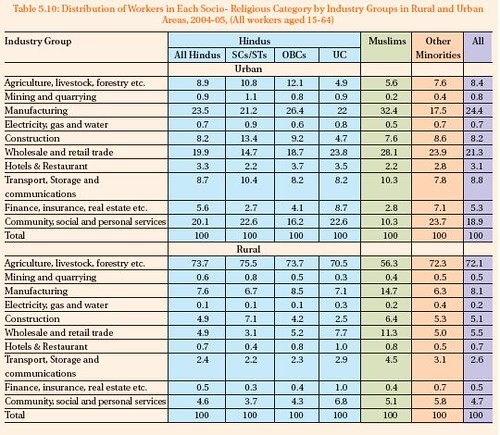
Distribution of Workers in Each Socio- Religious Category by Industry Groups in Rural and Urban Areas, 2004-05, (All workers aged 15-64)
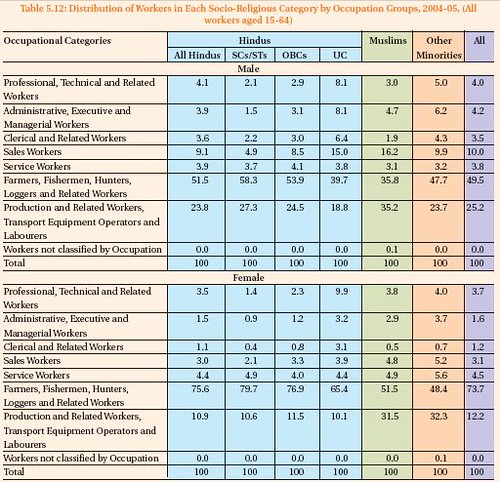
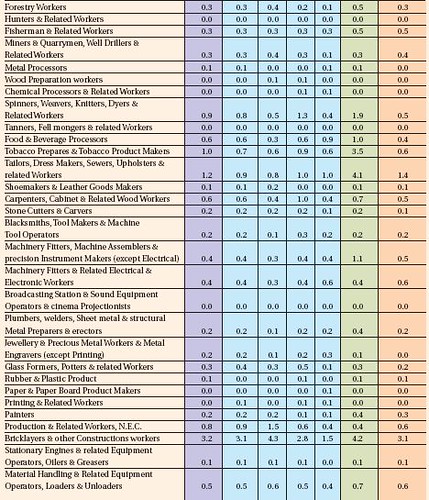
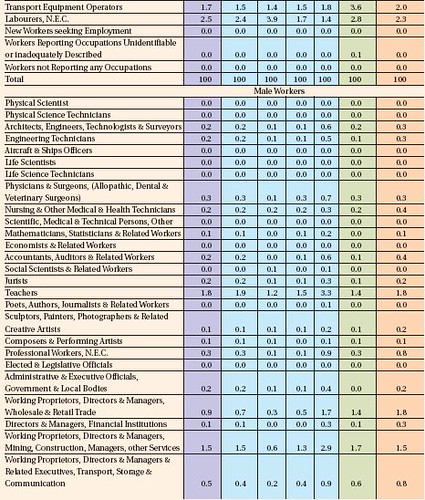
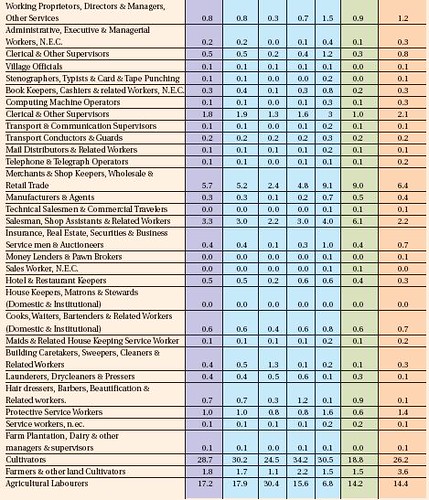
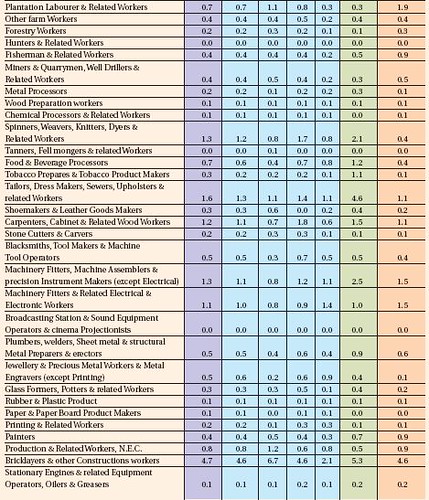
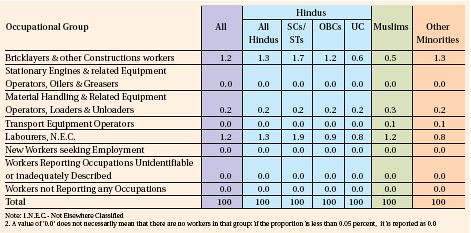
Distribution of Workers in Each Socio-Religious Category by Occupation Groups, 2004-05, (All workers aged 15-64)
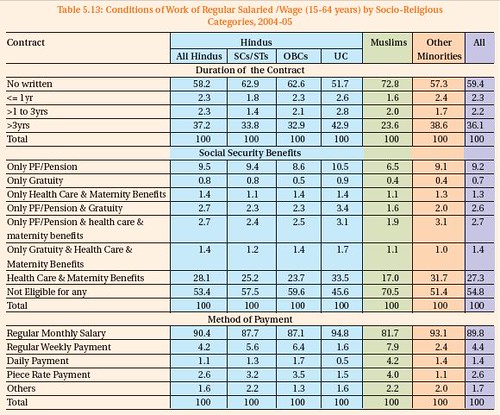
Conditions of Work of Regular Salaried /Wage (15-64 years) by Socio-Religious Categories, 2004-05
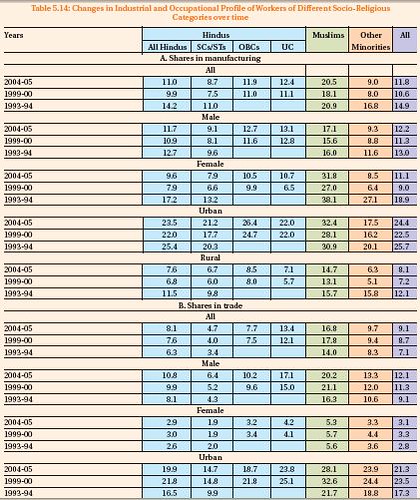
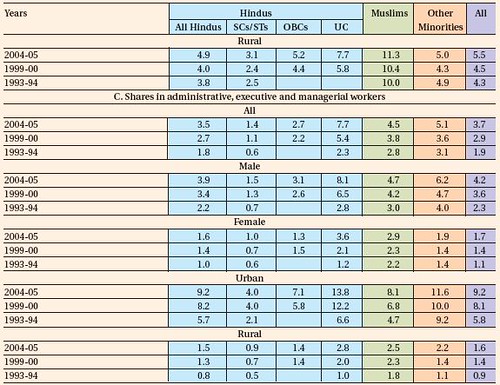
Changes in Industrial and Occupational Profile of Workers of Different Socio-Religious Categories over time
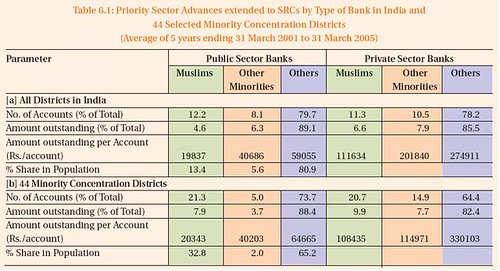
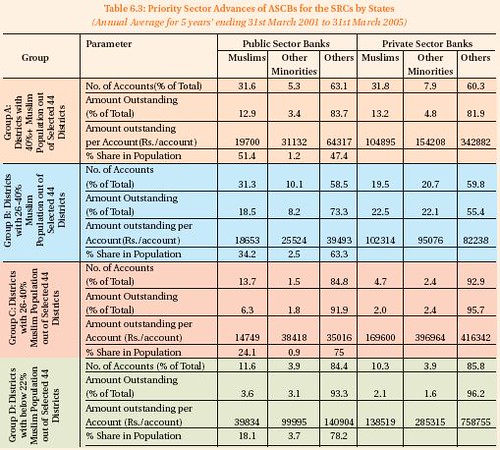
Priority Sector Advances extended to SRCs by Type of Bank in India and 44 Selected Minority Concentration Districts (Average of 5 years ending 31 March 2001 to 31 March 2005)
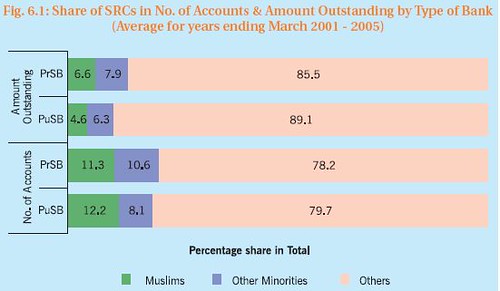
Share of SRCs in No. of Accounts & Amount Outstanding by Type of Bank (Average for years ending March 2001 – 2005)
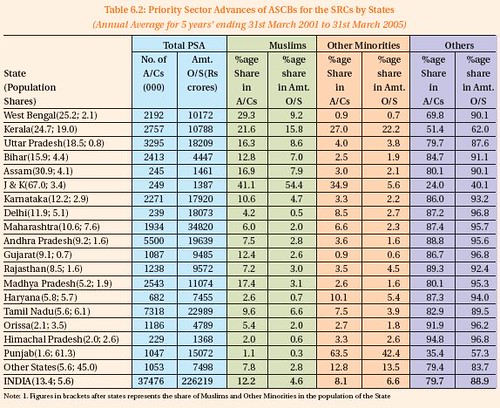
Priority Sector Advances of ASCBs for the SRCs by States (Annual Average for 5 years’ ending 31st March 2001 to 31st March 2005)
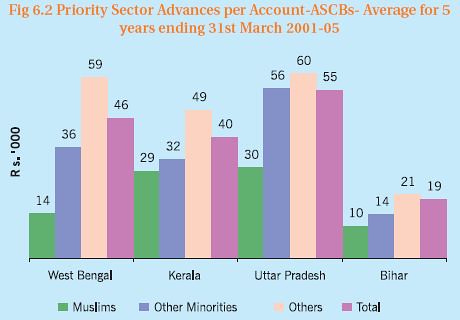
Sector Advances per Account-ASCBs- Average for 5 years ending 31st March 2001-05
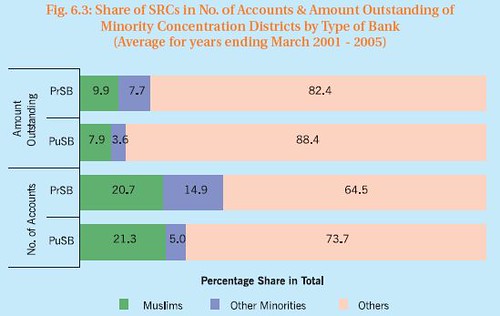
Share of SRCs in No. of Accounts & Amount Outstanding of Minority Concentration Districts by Type of Bank (Average for years ending March 2001 – 2005)
Priority Sector Advances of ASCBs for the SRCs by States (Annual Average for 5 years’ ending 31st March 2001 to 31st March 2005)
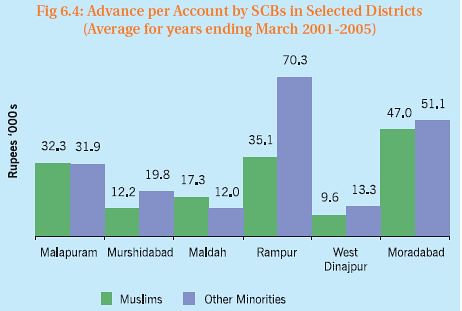
Advance per Account by SCBs in Selected Districts (Average for years ending March 2001-2005)
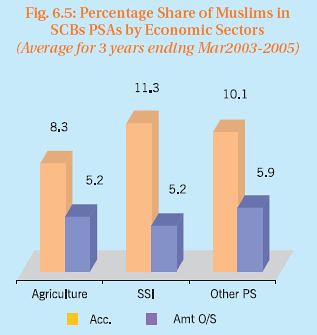
Percentage Share of Muslims in SCBs PSAs by Economic Sectors (Average for 3 years ending Mar2003-2005)
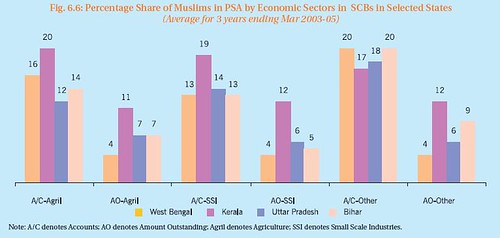
Percentage Share of Muslims in PSA by Economic Sectors in SCBs in Selected States (Average for 3 years ending Mar 2003-05)
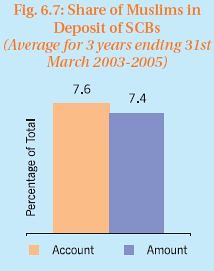
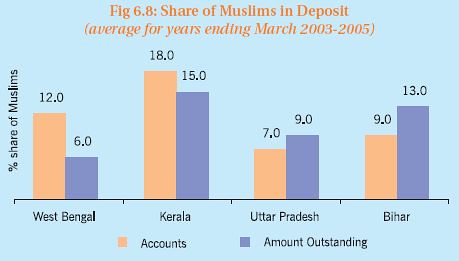
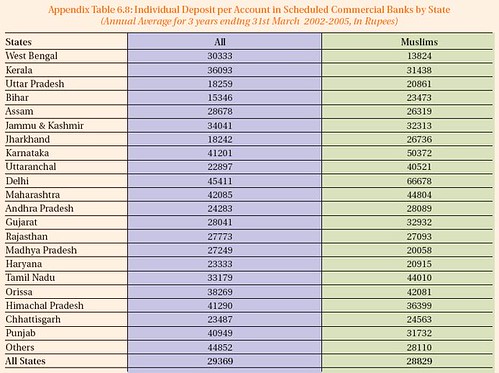
Share of Muslims in Deposit of SCBs (Average for 3 years ending 31st March 2003-2005)
Share of Muslims in Deposit (average for years ending March 2003-2005)
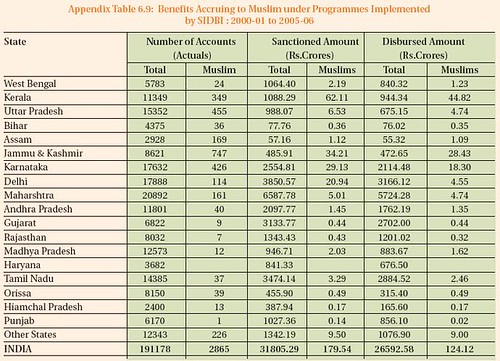
Percentage share of Muslims in Credit Extended by SIDBI – April 2000-March 2006

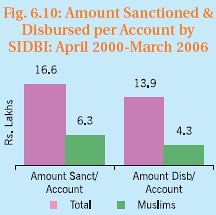
Amount Sanctioned & Disbursed per Account by SIDBI: April 2000-March 2006
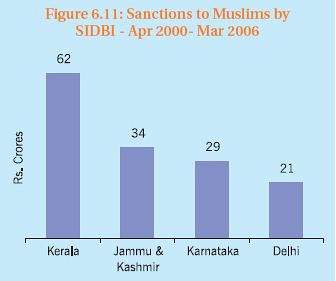
Sanctions to Muslims by SIDBI – Apr 2000- Mar 2006
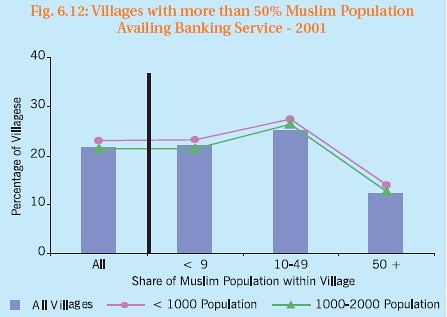
Villages with more than 50% Muslim Population Availing Banking Service – 2001
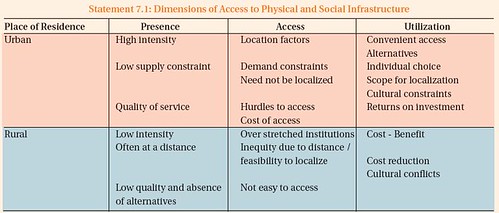
Dimensions of Access to Physical and Social Infrastructure
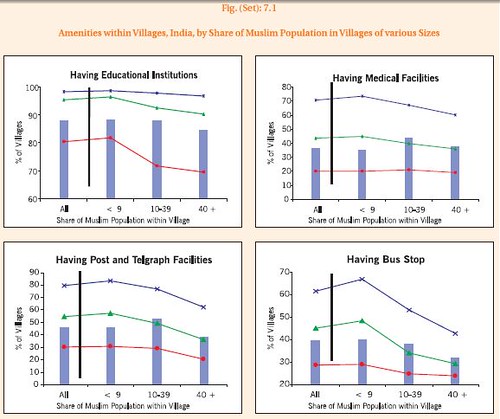
Amenities within villages, India, by Share of Muslim Population in Village of various Sizes
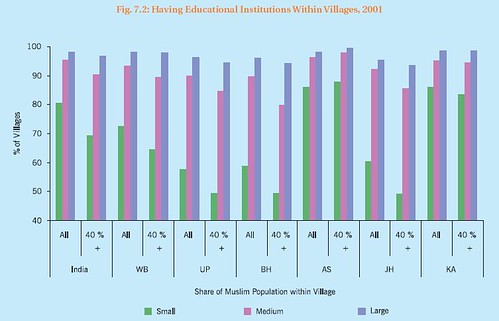
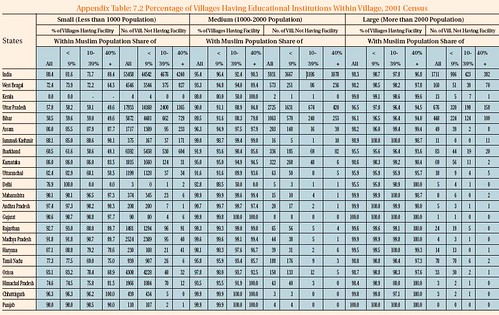
Having Educational Institutions Within Villages, 2001
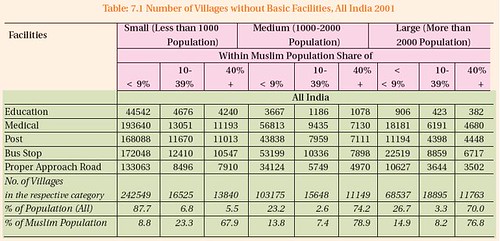
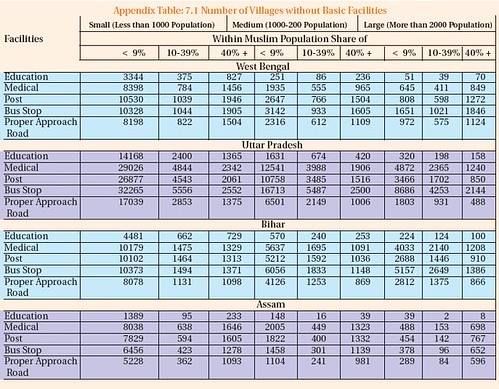
Number of Villages without Basic Facilities, All India 2001
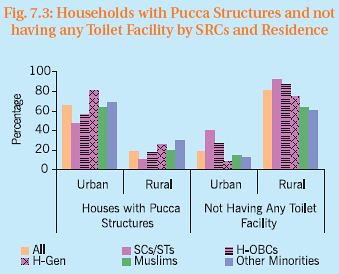
Households with Pucca Structures and not having any Toilet Facility by SRCs and Residence
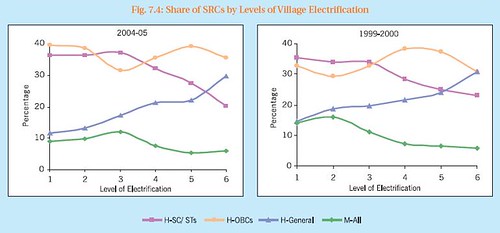
Share of SRCs by Levels of Village Electrification
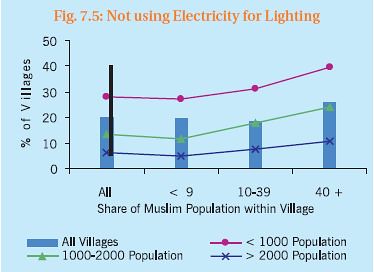
Not using Electricity for Lighting
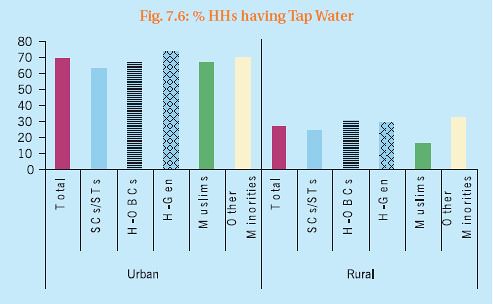
% HHs having Tap Water
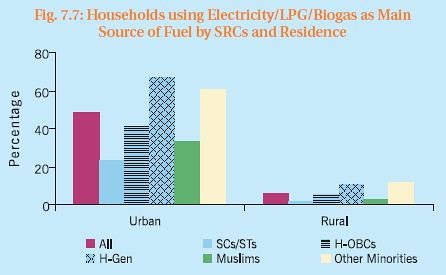
Households using Electricity/LPG/Biogas as Main Source of Fuel by SRCs and Residence
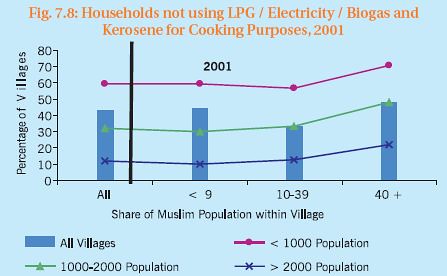
Households not using LPG / Electricity / Biogas and Kerosene for Cooking Purposes, 2001
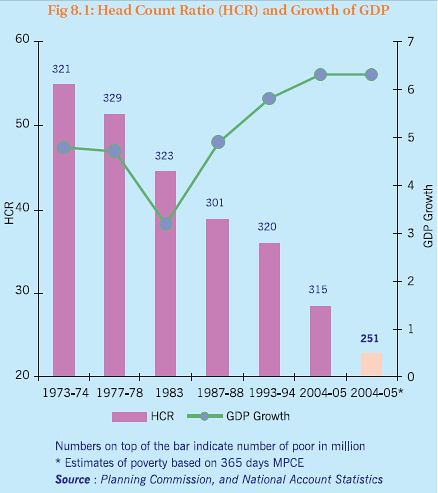
Head Count Ratio (HCR) and Growth of GDP
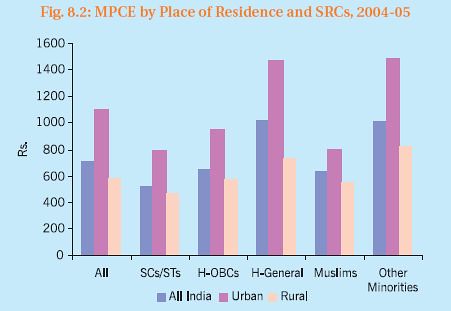
MPCE by Place of Residence and SRCs, 2004-05
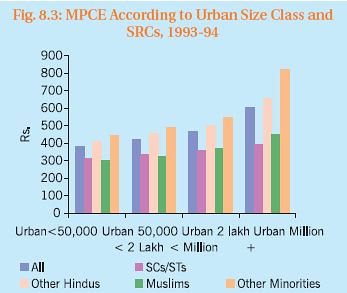
MPCE According to Urban Size Class and SRCs, 1993-94
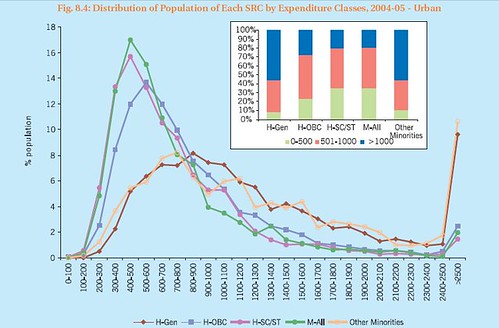
Distribution of Population of Each SRC by Expenditure Classes, 2004-05 – Urban
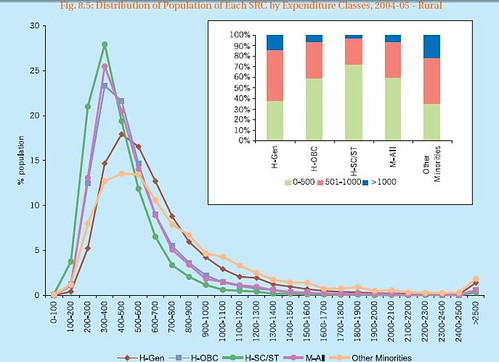
Distribution of Population of Each SRC by Expenditure Classes, 2004-05 – Rural
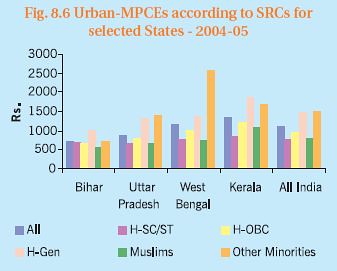
Urban-MPCEs according to SRCs for selected States – 2004-05
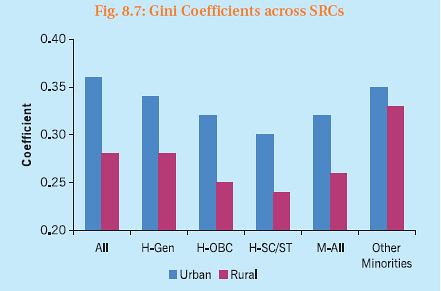
Gini Coefficients across SRCs
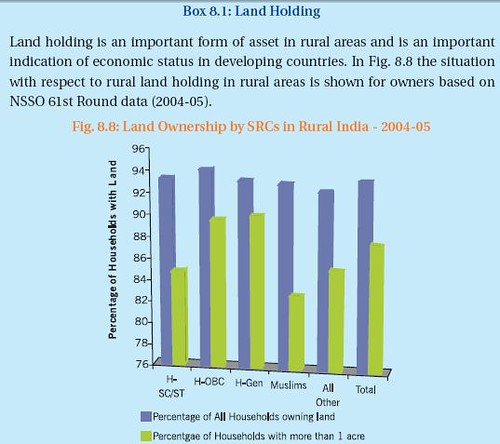
Land Holding
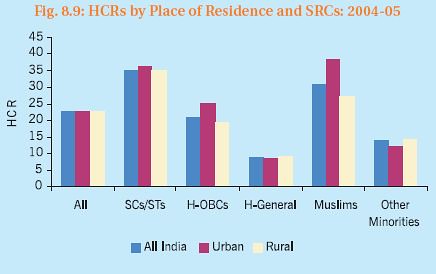
HCRs by Place of Residence and SRCs: 2004-05
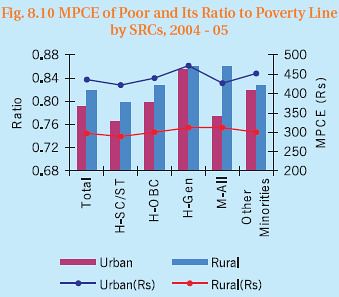
MPCE of Poor and Its Ratio to Poverty Line by SRCs, 2004 – 05
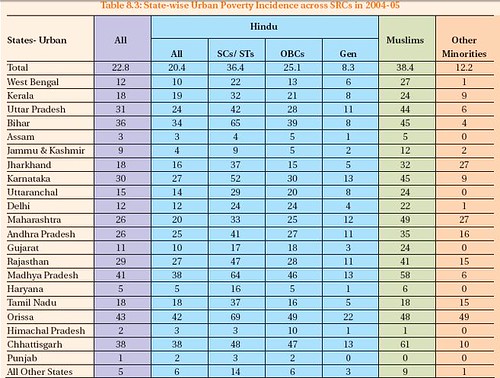
State-wise Urban Poverty Incidence across SRCs in 2004-05
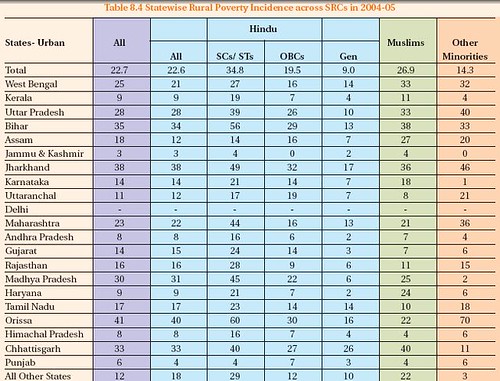
Statewise Rural Poverty Incidence across SRCs in 2004-05
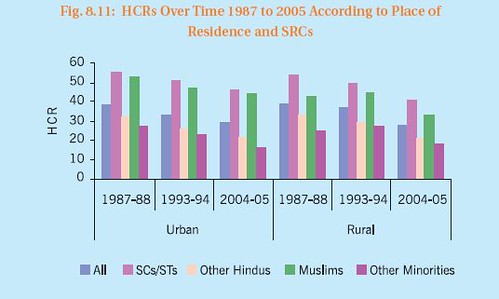
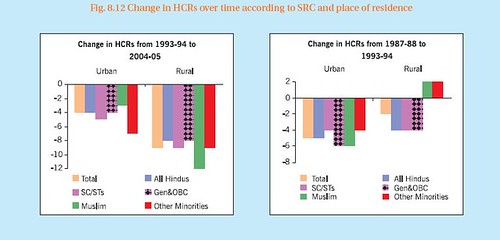
HCRs Over Time 1987 to 2005 According to Place of Residence and SRCs
Change in HCRs over time according to SRC and place of residence
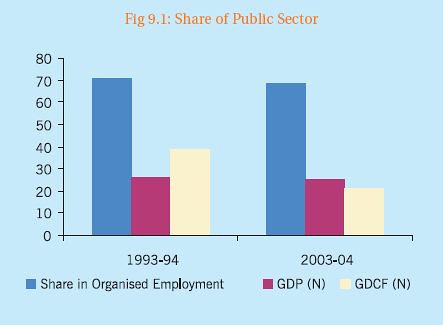
Share of Public Sector
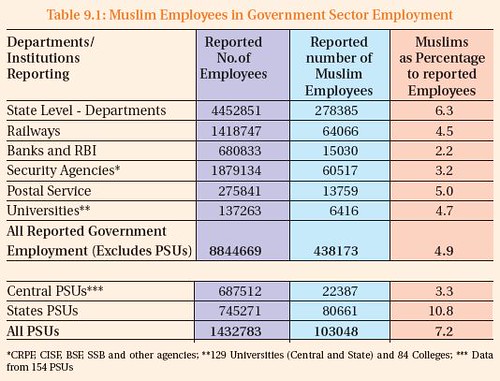
Muslim Employees in Government Sector Employment
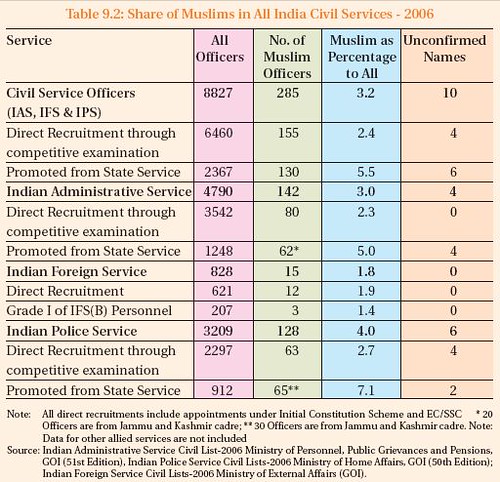
Share of Muslims in All India Civil Services – 2006
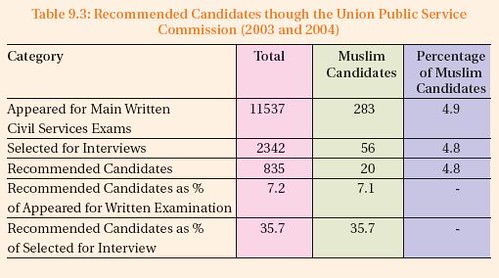
Recommended Candidates though the Union Public Service Commission (2003 and 2004)
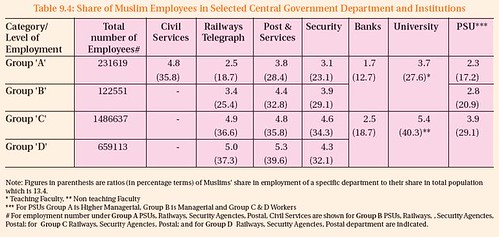
Share of Muslim Employees in Selected Central Government Department and Institutions
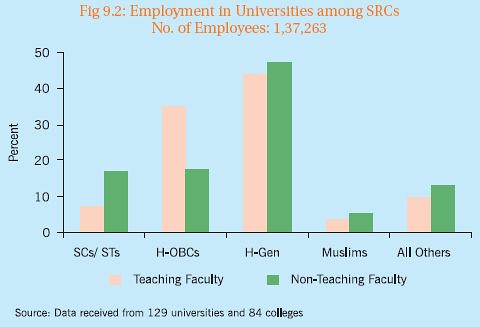
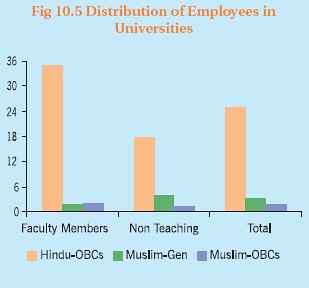
Employment in Universities among SRCs No. of Employees: 1,37,263
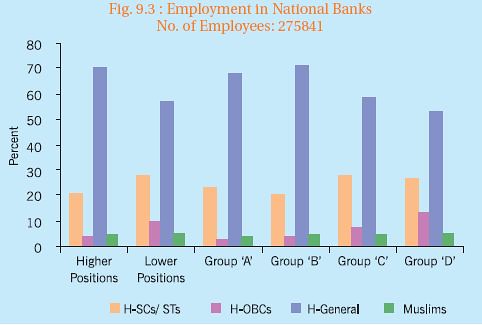
Employment in National Banks No. of Employees: 275841
Employment in Central PSUs No. of Employees: 687512

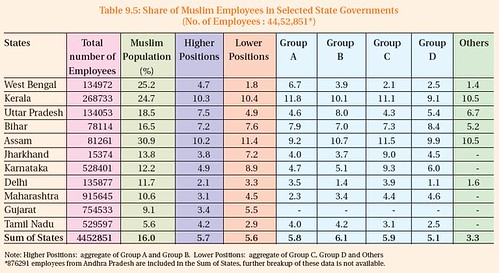
Share of Muslim Employees in Selected State Governments (No. of Employees : 44,52,851*)
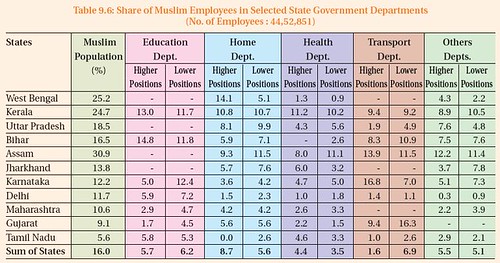
Share of Muslim Employees in Selected State Government Departments (No. of Employees : 44,52,851)
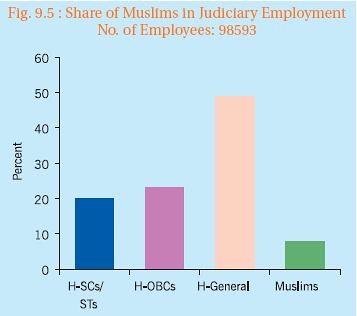
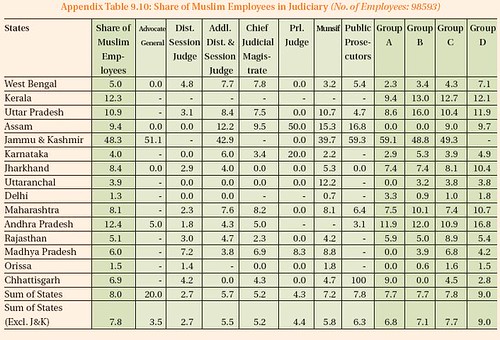
Share of Muslims in Judiciary Employment No. of Employees: 98593
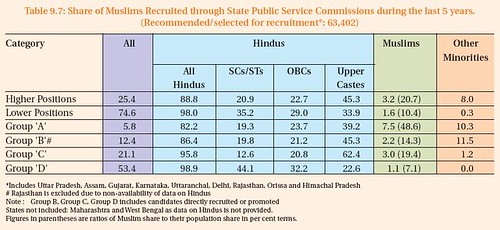
Share of Muslims Recruited through State Public Service Commissions during the last 5 years. (Recommended/selected for recruitment*: 63,402)
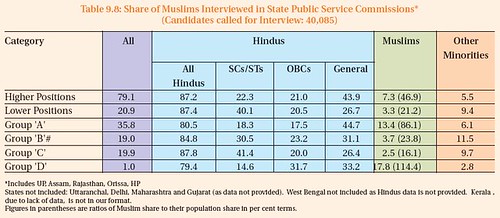
Share of Muslims Interviewed in State Public Service Commissions* (Candidates called for Interview: 40,085)
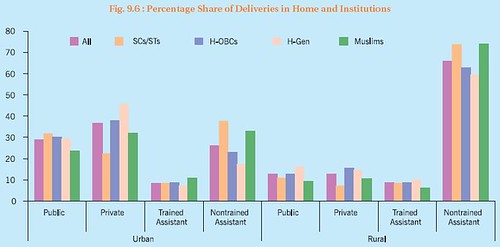
Percentage Share of Deliveries in Home and Institutions
Percentage Coverage of the ICDS for 0-6 years old Population by States and SRCs 2004-05

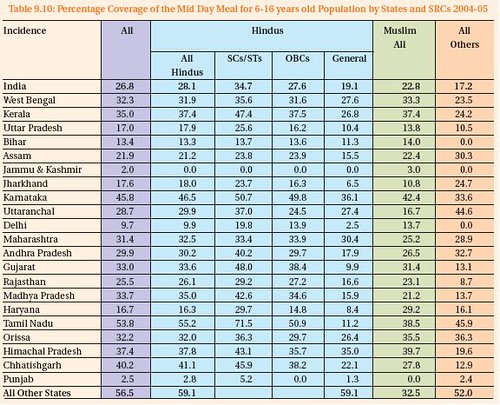
Percentage Coverage of the Mid Day Meal for 6-16 years old Population by States and SRCs 2004-05
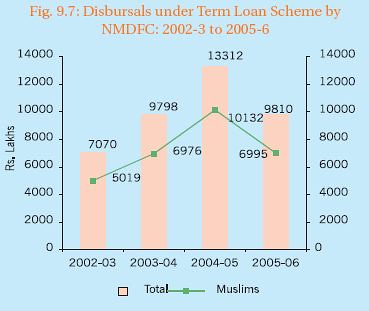
Disbursals under Term Loan Scheme by NMDFC: 2002-3 to 2005-6
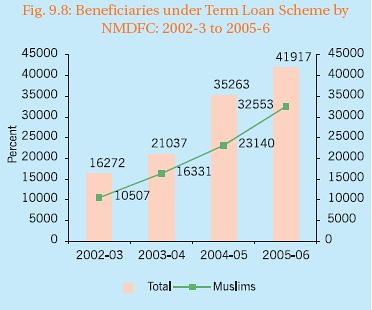
Beneficiaries under Term Loan Scheme by NMDFC: 2002-3 to 2005-6
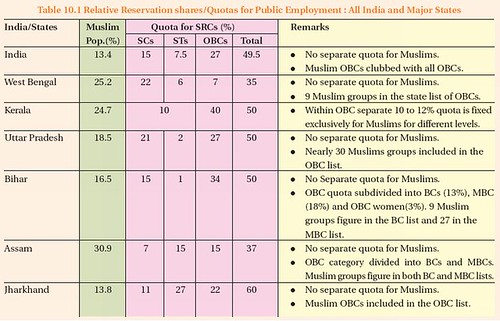
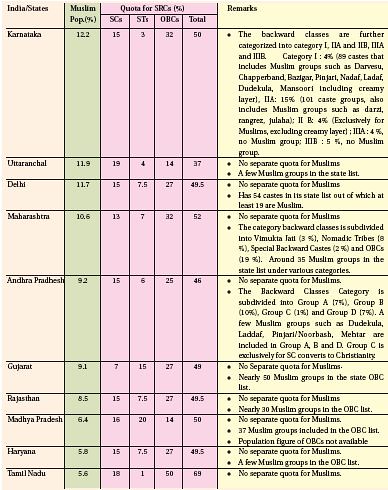
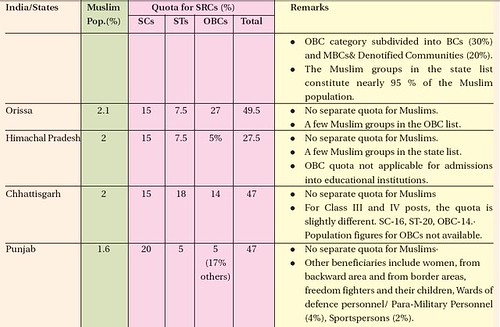
Relative Reservation shares/Quotas for Public Employment : All India and Major States
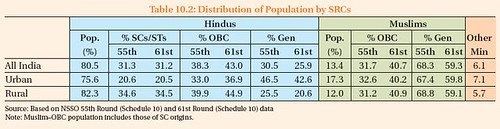
Distribution of Population by SRCs
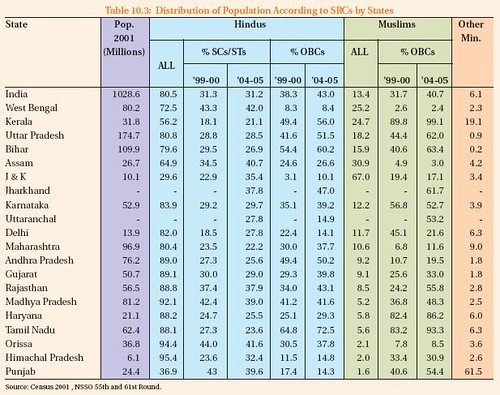
Distribution of Population According to SRCs by States
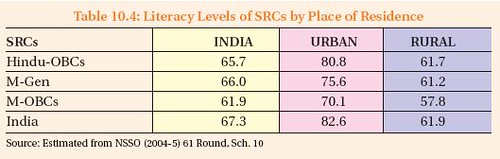
Literacy Levels of SRCs by Place of Residence
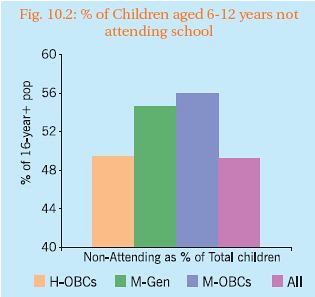
% of Children aged 6-12 years not attending school
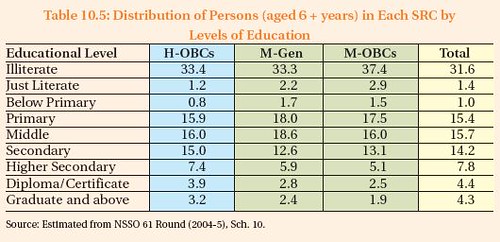
Distribution of Persons (aged 6 + years) in Each SRC by Levels of Education
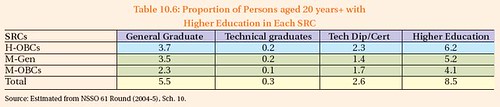
Proportion of Persons aged 20 years+ with Higher Education in Each SRC
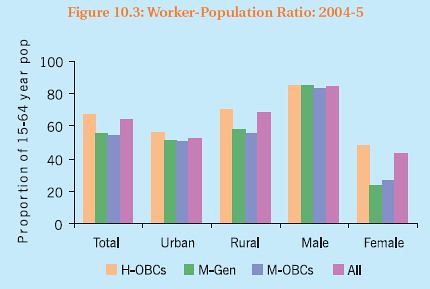
Worker-Population Ratio: 2004-5
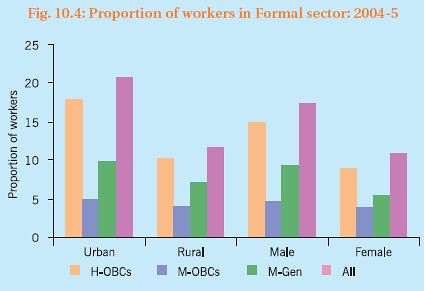
Proportion of workers in Formal sector: 2004-5
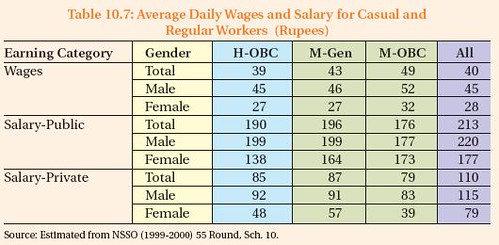
Average Daily Wages and Salary for Casual and Regular Workers (Rupees)
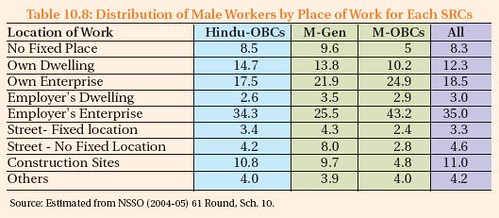
Distribution of Male Workers by Place of Work for Each SRCs
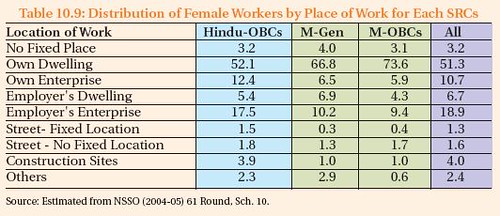
Distribution of Female Workers by Place of Work for Each SRCs
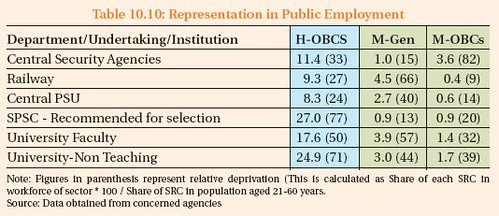
Representation in Public Employment
Distribution of Employees in Universities
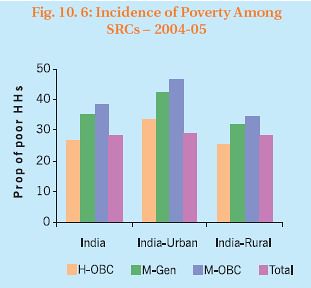
Incidence of Poverty Among SRCs – 2004-05
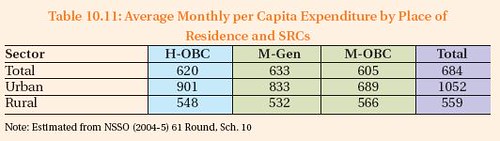
Average Monthly per Capita Expenditure by Place of Residence and SRCs
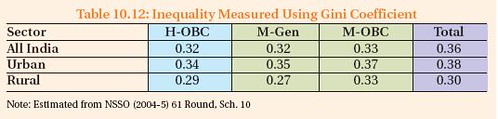
Inequality Measured Using Gini Coefficient
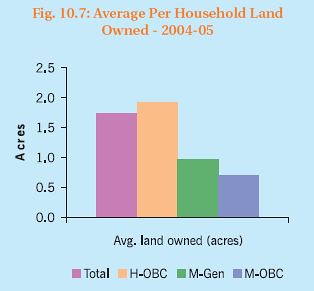
Average Per Household Land Owned – 2004-05
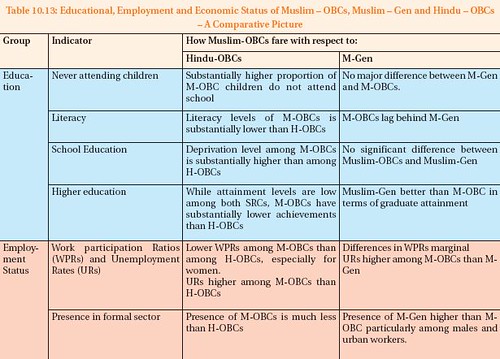
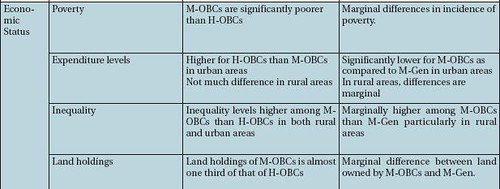
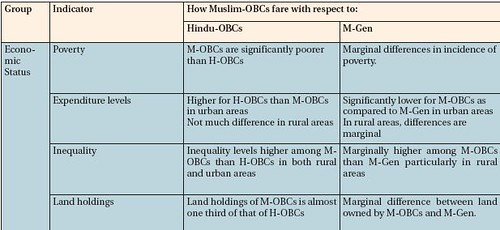
Educational, Employment and Economic Status of Muslim – OBCs,Muslim – Gen and Hindu – OBCs – A Comparative Picture
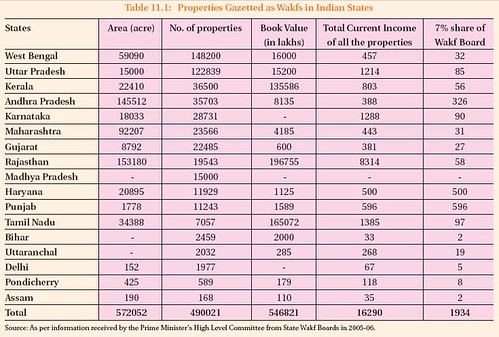
Properties Gazetted as Wakfs in Indian States
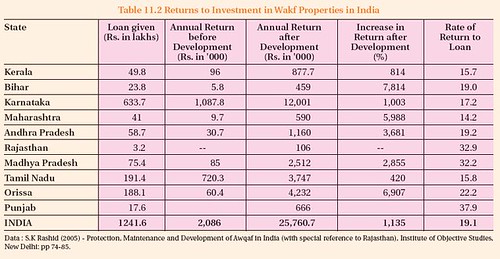
Returns to Investment in Wakf Properties in India
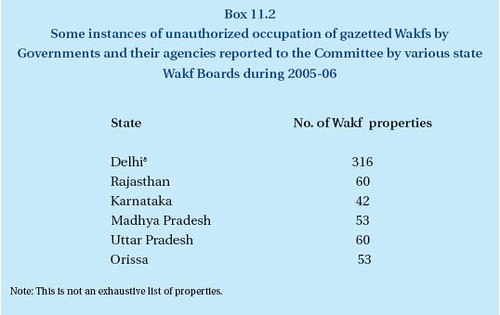
Some instances of unauthorized occupation of gazetted Wakfs by Governments and their agencies reported to the Committee by various state Wakf Boards during 2005-06
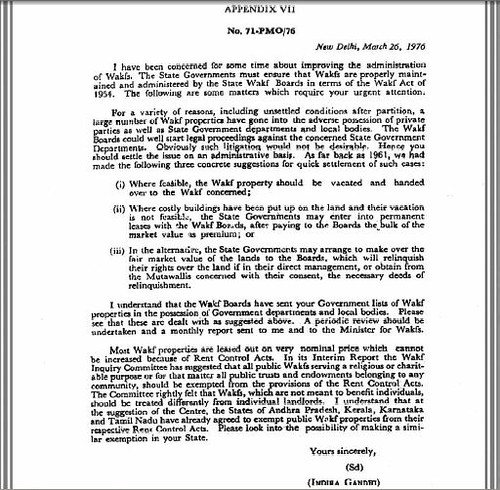
Prime Minister Indira Gandhi’s letter addressed to the Chief Ministers
Mandate of the Joint Parliamentary Committee on Wakfs – 1996-2006

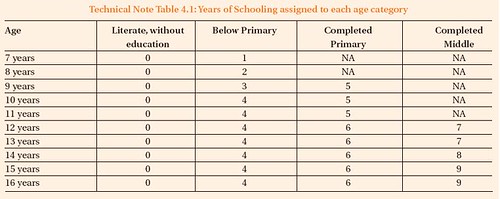
Years of Schooling assigned to each age category
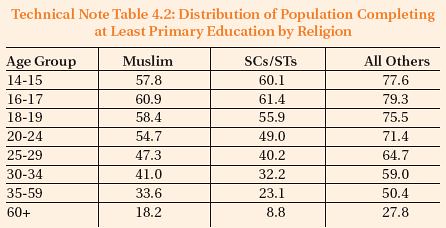
Distribution of Population Completing at Least Primary Education by Religion
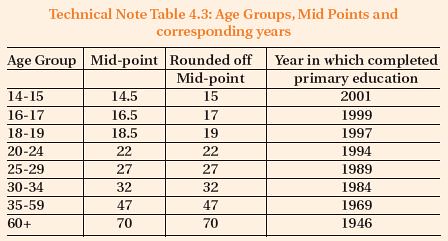
Age Groups,Mid Points and corresponding years
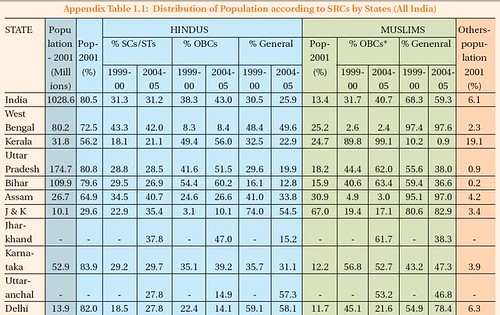
Distribution of Population according to SRCs by States (All India)
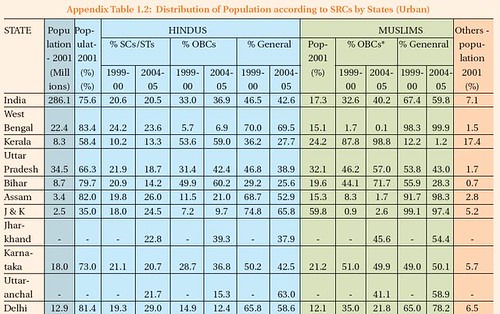
Distribution of Population according to SRCs by States (Urban)
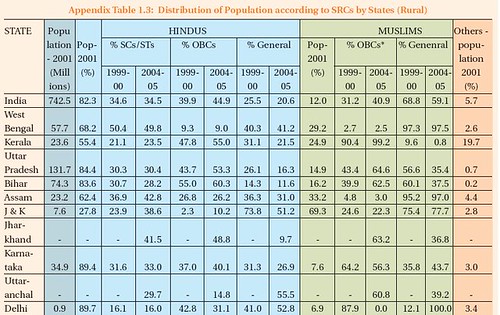
Distribution of Population according to SRCs by States (Rural)
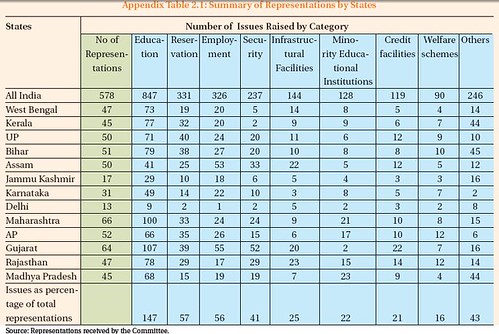
Summary of Representations by States
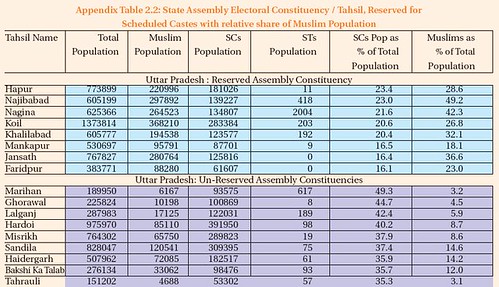
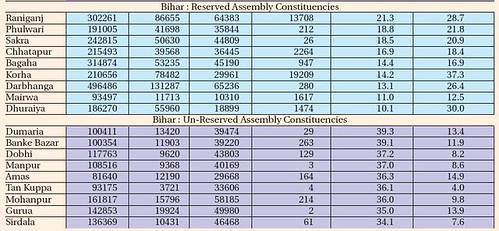
State Assembly Electoral Constituency / Tahsil, Reserved for Scheduled Castes with relative share of Muslim Population

Population Trends for Major Religions of India, 1961-2001
Population Trends among All Population and Muslim Population – India and Large States, 1961-2001 (Population in thousands)
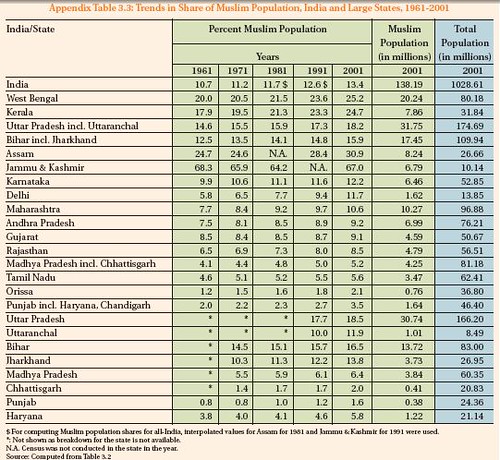
Trends in Share of Muslim Population, India and Large States, 1961-2001
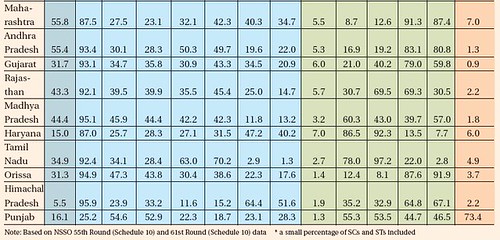
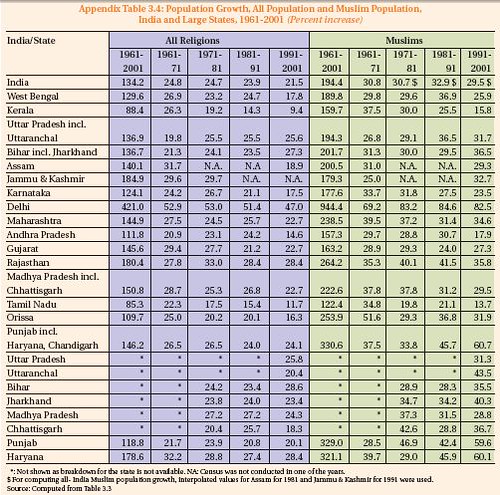
Population Growth, All Population and Muslim Population, India and Large States, 1961-2001 (Percent increase)
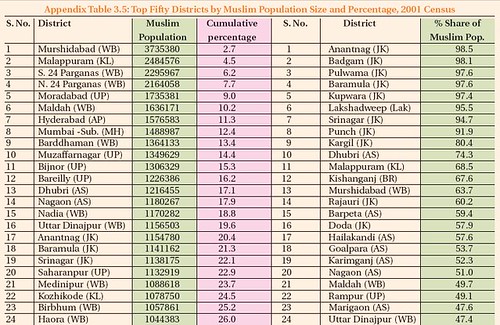
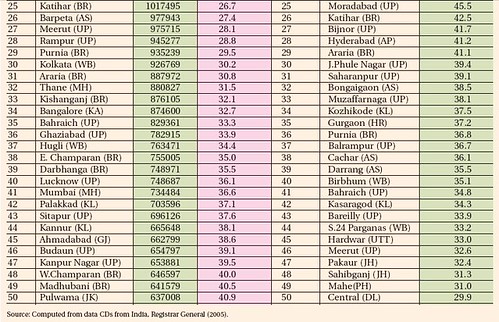
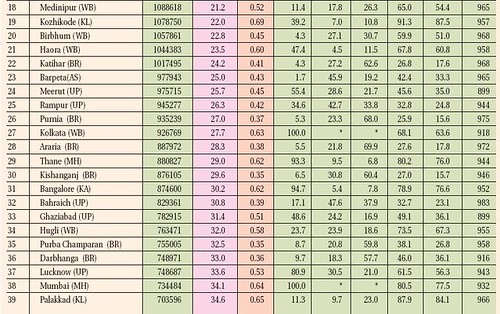
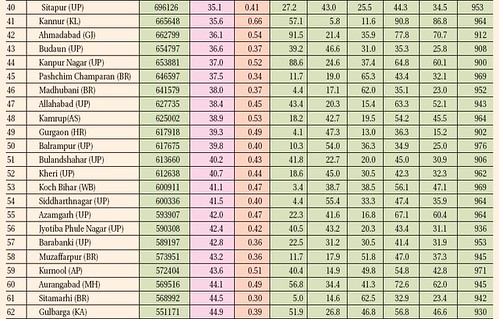
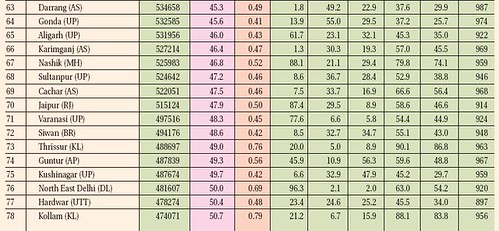
Top Fifty Districts by Muslim Population Size and Percentage, 2001 Census
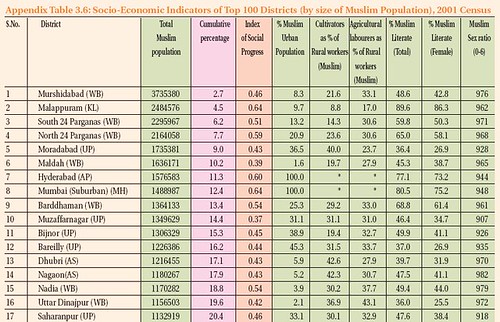
Socio-Economic Indicators of Top 100 Districts (by size of Muslim Population), 2001 Census

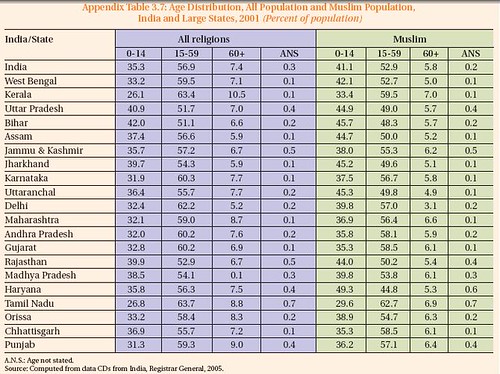
Age Distribution, All Population and Muslim Population, India and Large States, 2001 (Percent of population)
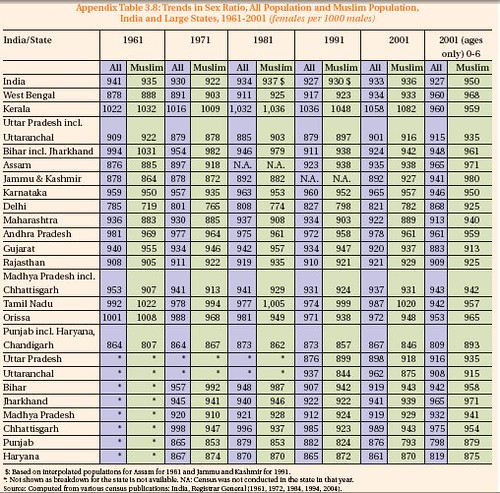
Trends in Sex Ratio, All Population and Muslim Population, India and Large States, 1961-2001 (females per 1000 males)
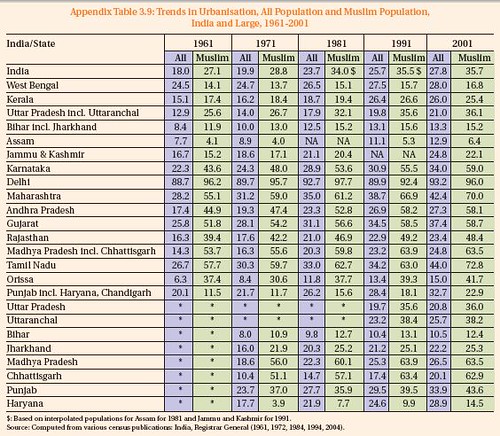
Trends in Urbanisation, All Population and Muslim Population, India and Large, 1961-2001
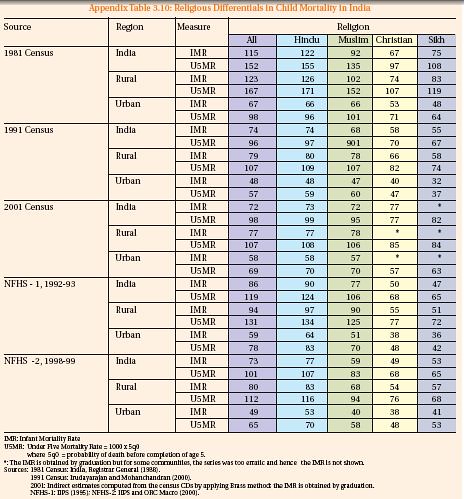
Religious Differentials in Child Mortality in India
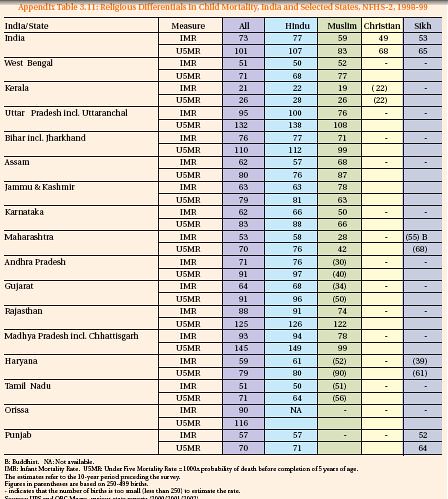
Religious Differentials in Child Mortality, India and Selected States, NFHS-2, 1998-99
Religious Differentials in Fertility, India and Large States, NFHS-2, 1998-99
Contraceptive Prevalence Rate by Religion, India and Large States, NFHS-2, 1998-99 (Percent of Couples of Reproductive Ages Practising Contraception)
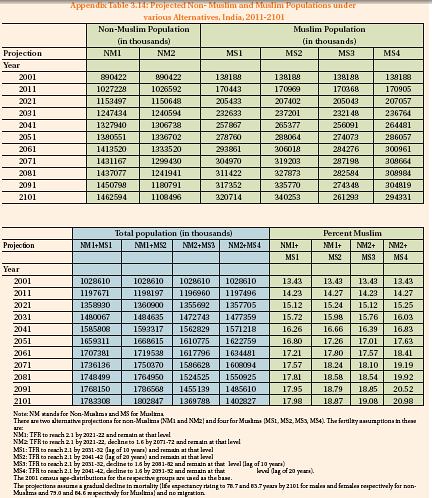
Projected Non- Muslim and Muslim Populations under various Alternatives, India, 2011-2101
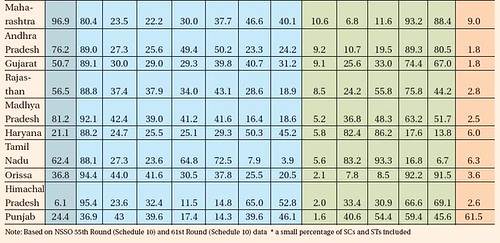
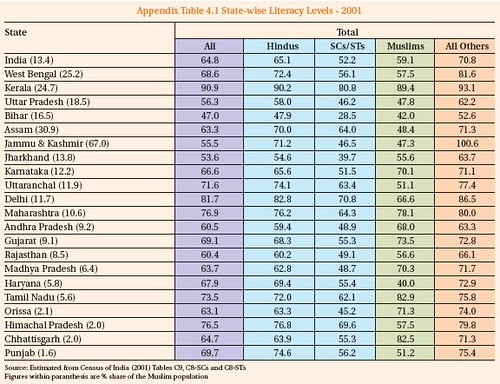
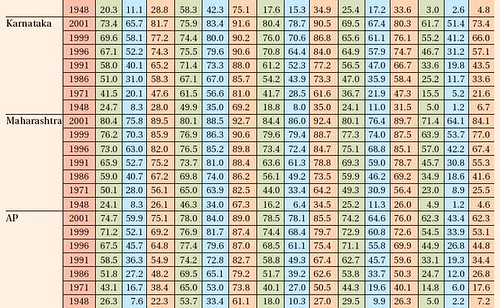
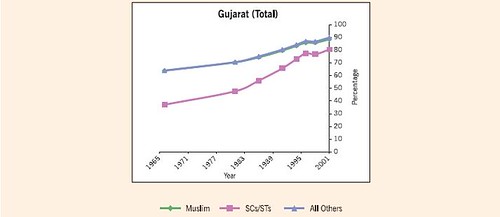
State-wise Literacy Levels – 2001
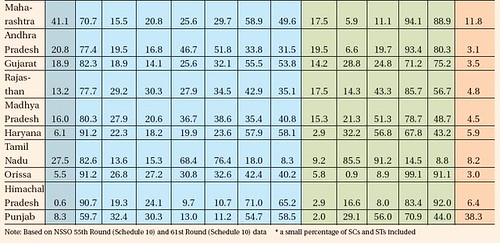
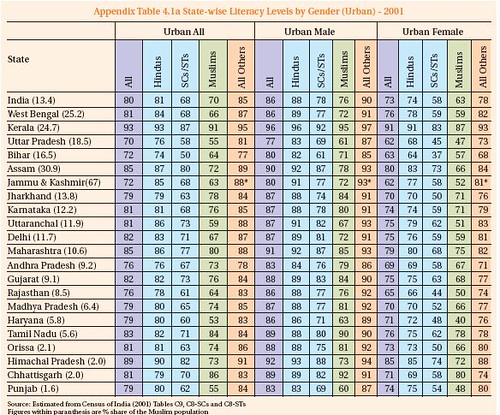
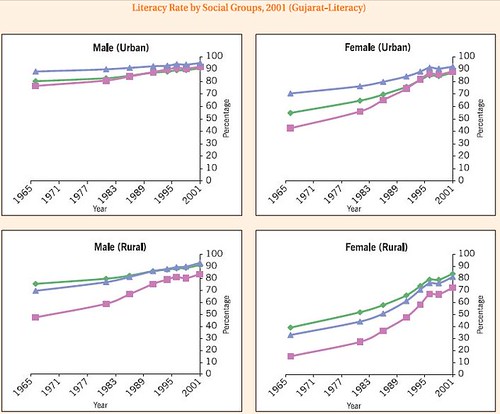
State-wise Literacy Levels by Gender (Urban) – 2001
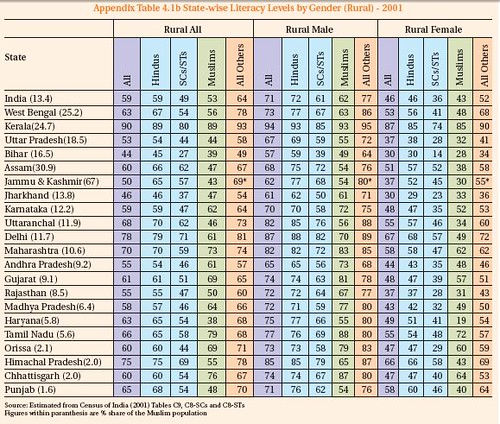
State-wise Literacy Levels by Gender (Rural) – 2001
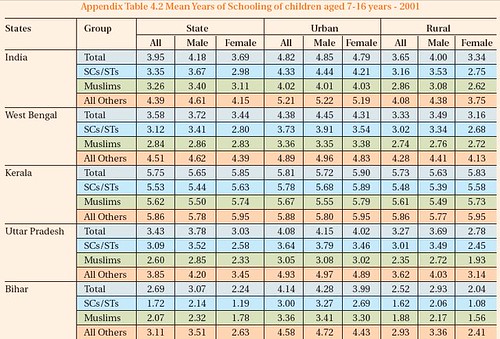
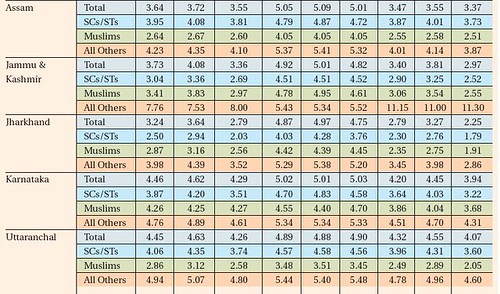
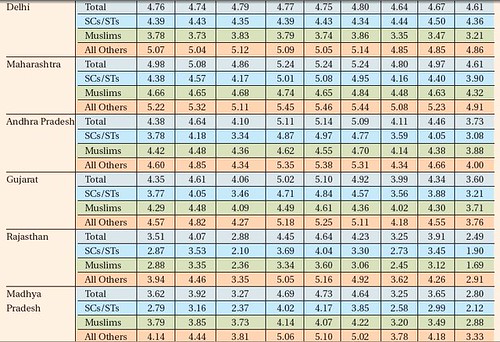
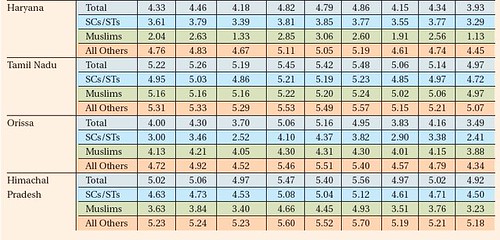
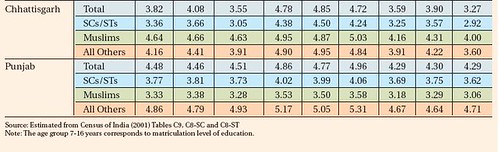
Mean Years of Schooling of children aged 7-16 years – 2001
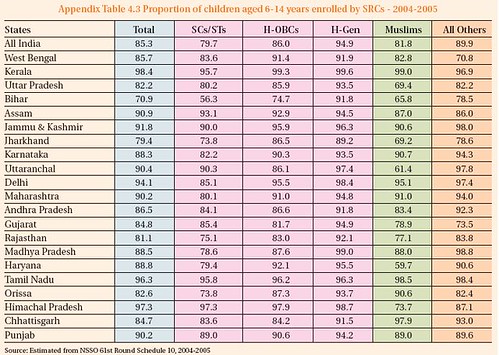
Proportion of children aged 6-14 years enrolled by SRCs – 2004-2005
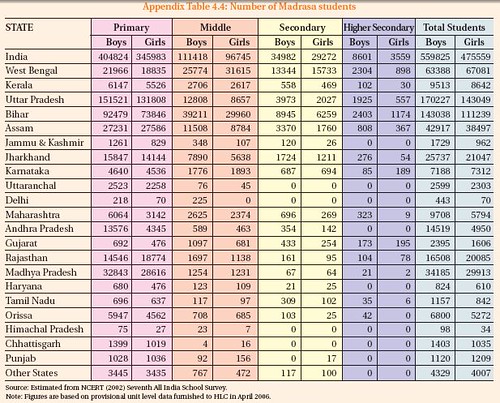
Number of Madrasa students
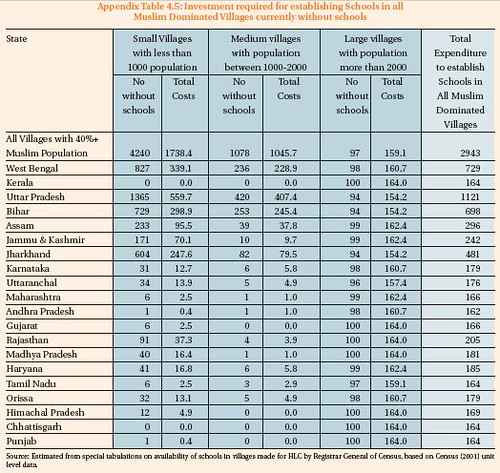
Investment required for establishing Schools in all Muslim Dominated Villages currently without schools
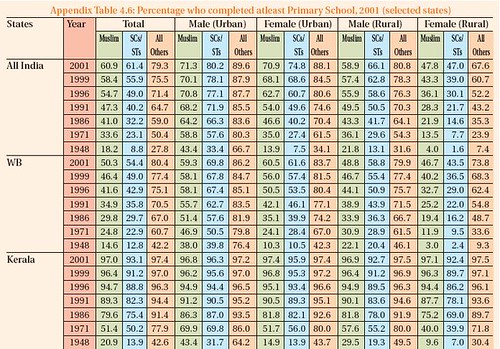
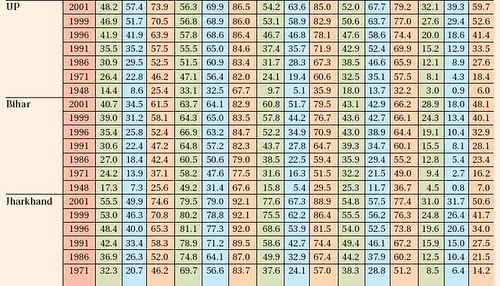
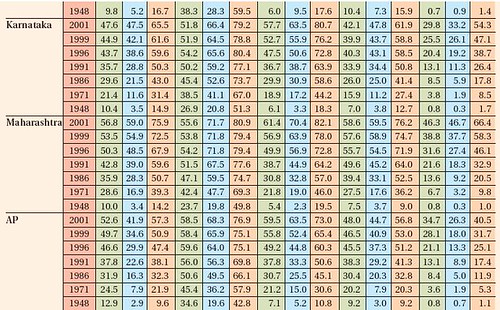
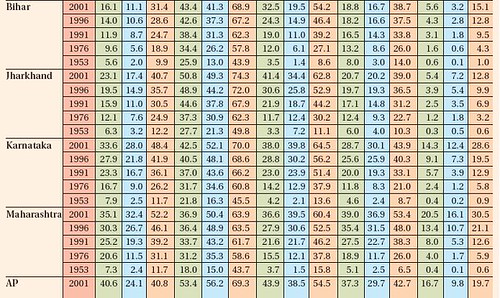
Percentage who completed atleast Primary School, 2001 (selected states)

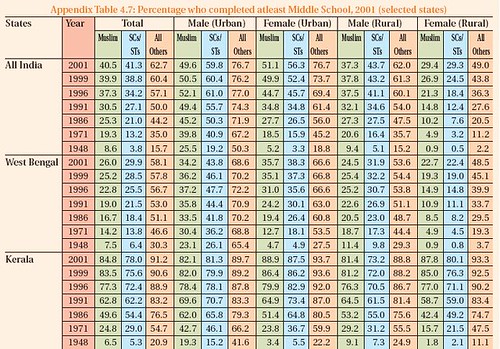
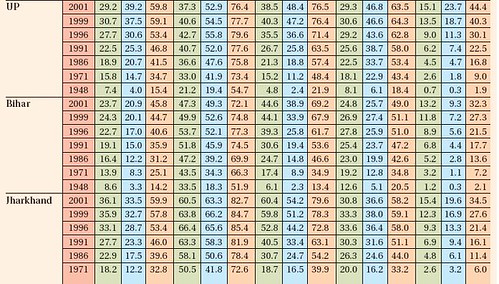
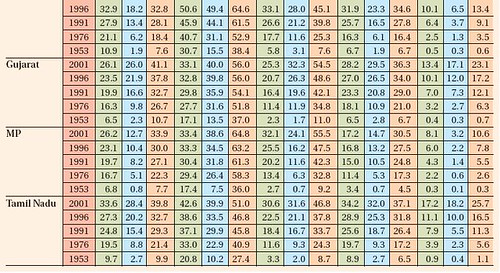
Percentage who completed atleast Middle School, 2001 (selected states)
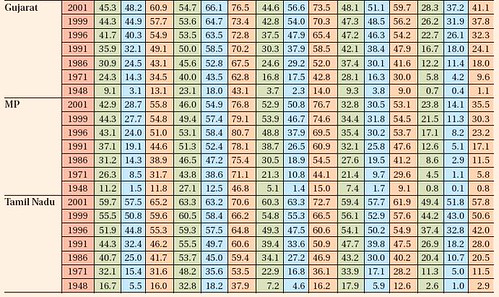
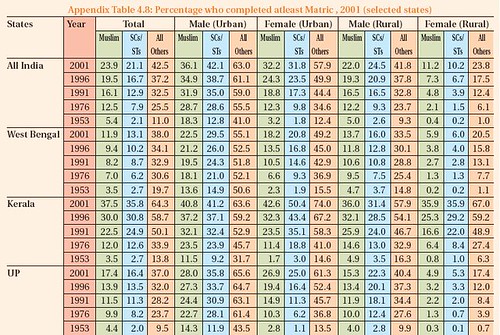
Percentage who completed atleast Matric , 2001 (selected states)
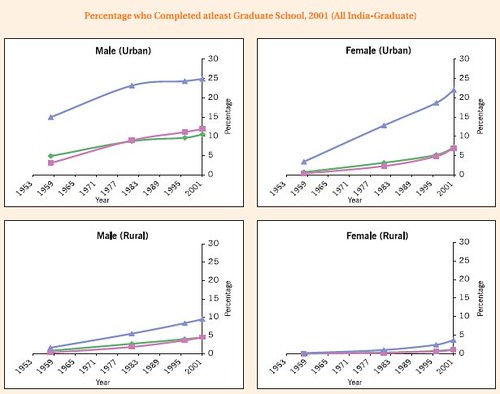
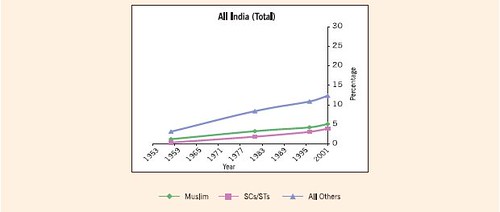
Percentage who Completed atleast Graduate School, 2001 (All India-Graduation)
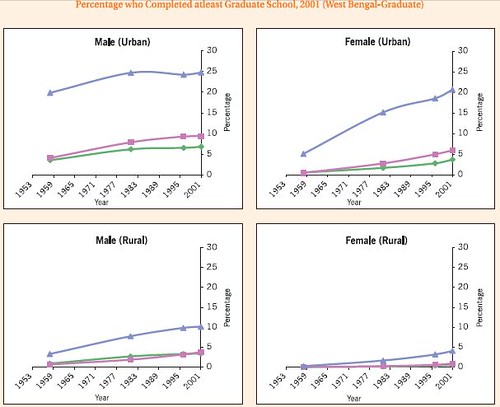
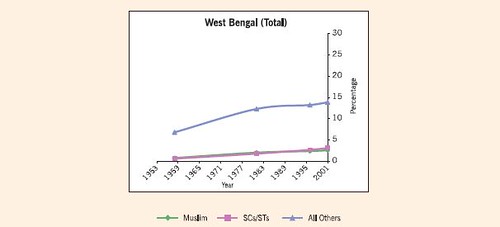
Percentage who Completed atleast Graduate School, 2001 (Bengal-Graduate)
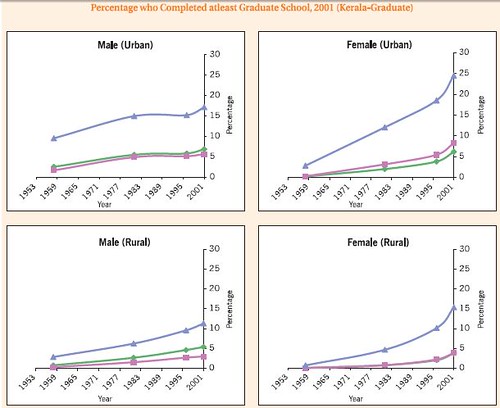
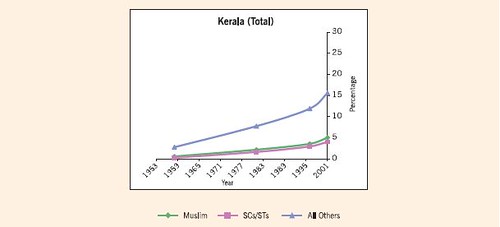
Percentage who Completed atleast Graduate School, 2001 (Kerala-Graduate)
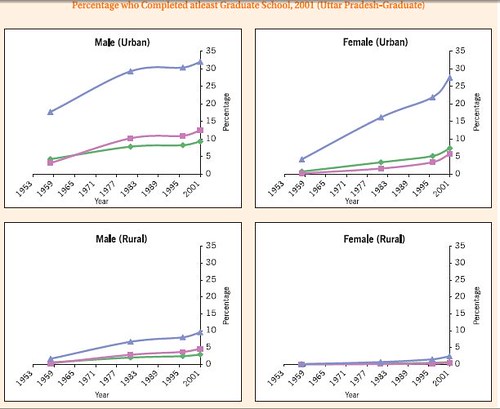
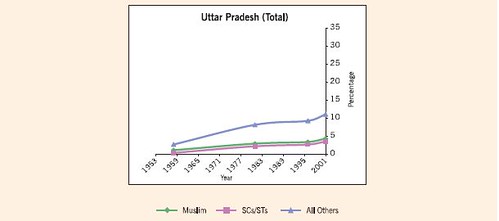
Percentage who Completed atleast Graduate School, 2001 (Uttar Pradesh-Graduate)
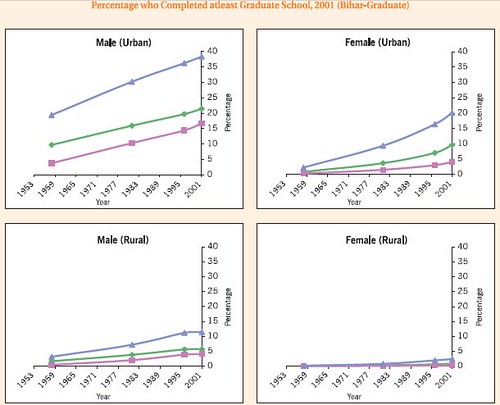
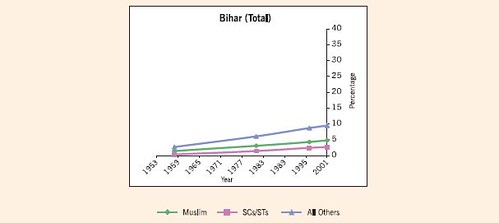
Percentage who Completed atleast Graduate School, 2001 (Bihar-Graduate)
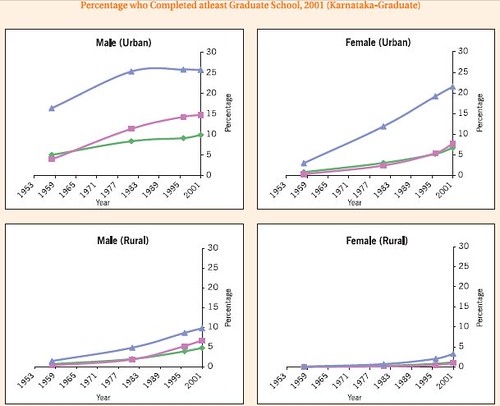
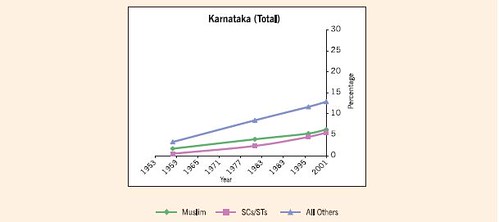
Percentage who Completed atleast Graduate School, 2001 (Karnataka-Graduate)
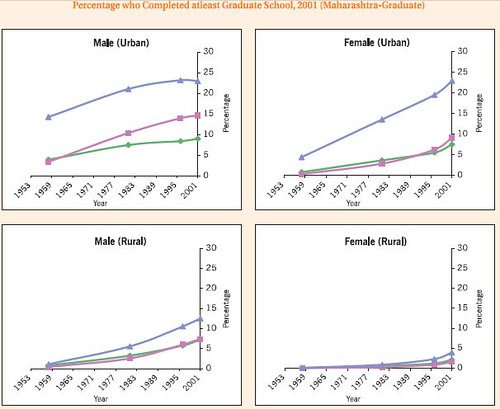
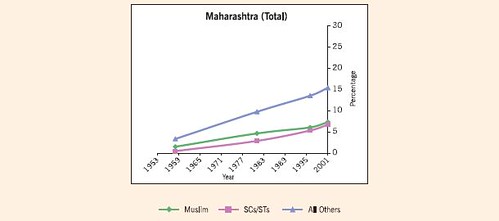
Percentage who Completed atleast Graduate School, 2001 (Maharashtra-Graduate)
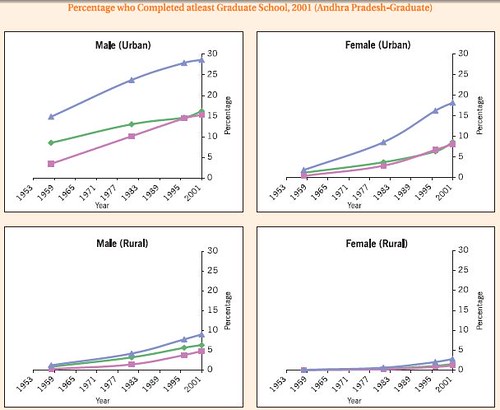
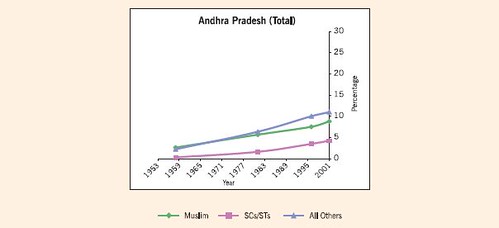
Percentage who Completed atleast Graduate School, 2001 (Andhra Pradesh-Graduate)
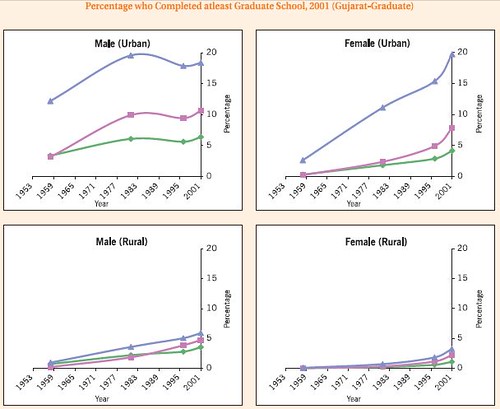
Percentage who Completed atleast Graduate School, 2001 (Gujarat-Graduate)

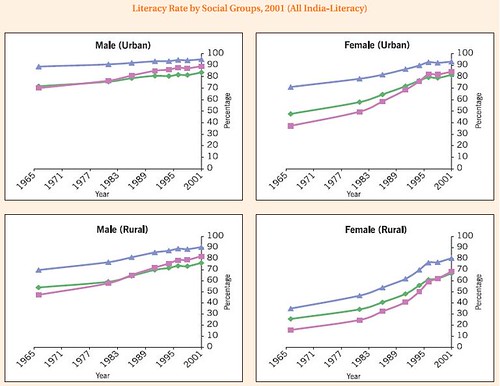
Literacy Rate by Social Groups, 2001 (All India-Literacy)
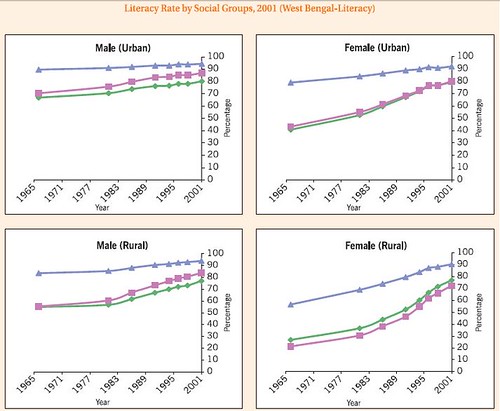
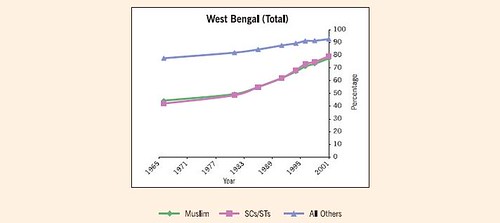
Literacy Rate by Social Groups, 2001 (West Bengal-Literacy)
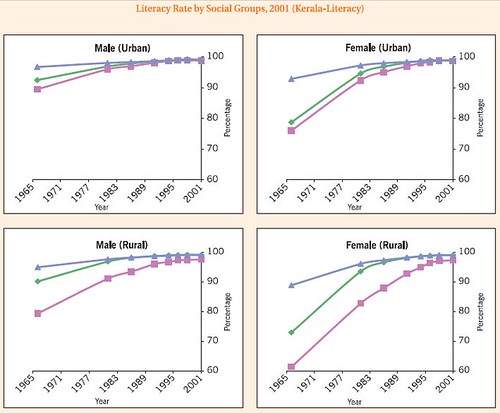
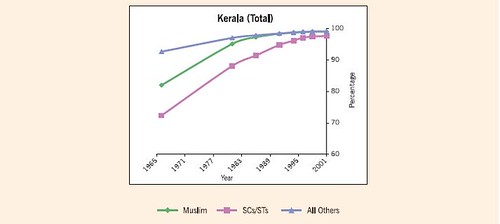
Literacy Rate by Social Groups, 2001 (Kerala-Literacy)
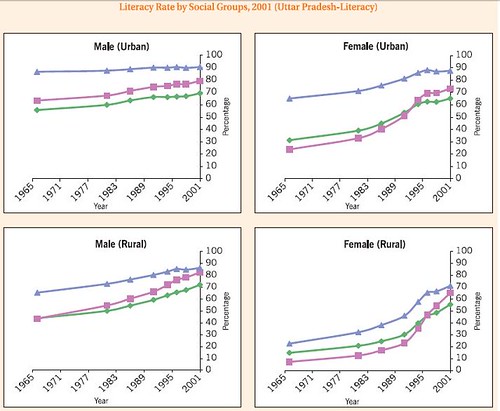
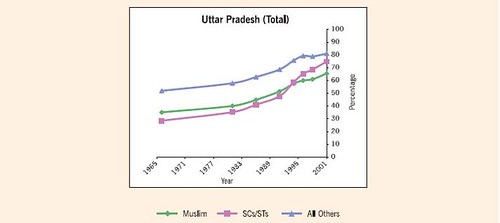
Literacy Rate by Social Groups, 2001 (Uttar Pradesh-Literacy)
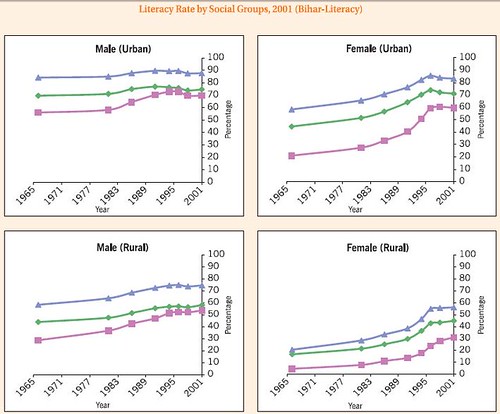
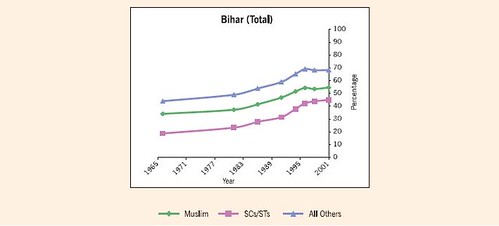
Literacy Rate by Social Groups, 2001 (Bihar-Literacy)
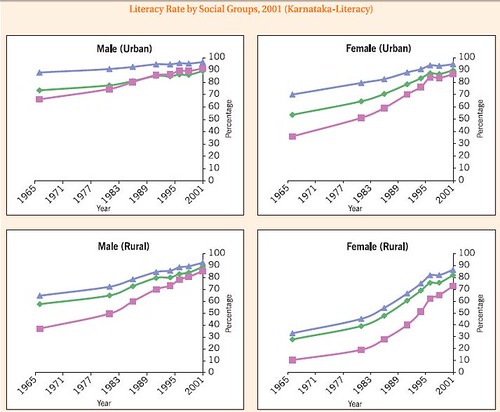
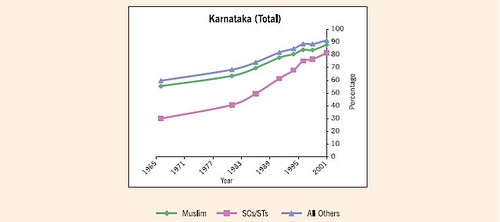
Literacy Rate by Social Groups, 2001 (Karnataka-Literacy)
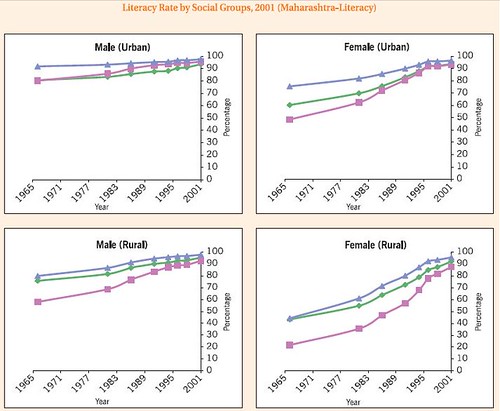
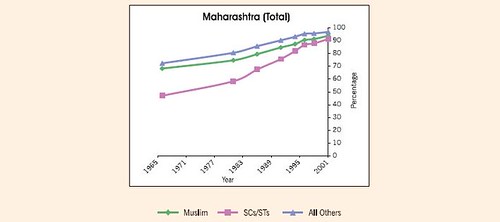
Literacy Rate by Social Groups, 2001 (Maharashtra-Literacy)
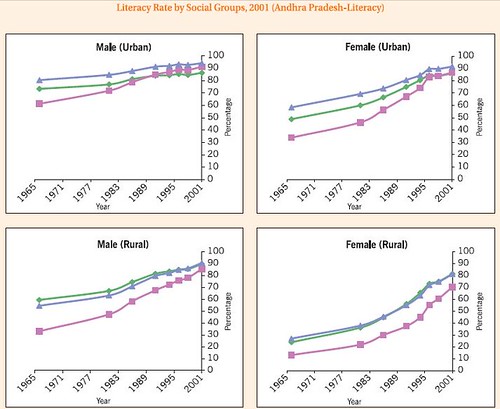
Literacy Rate by Social Groups, 2001 (Andhra Pradesh-Literacy)
Literacy Rate by Social Groups, 2001 (Gujarat-Literacy)
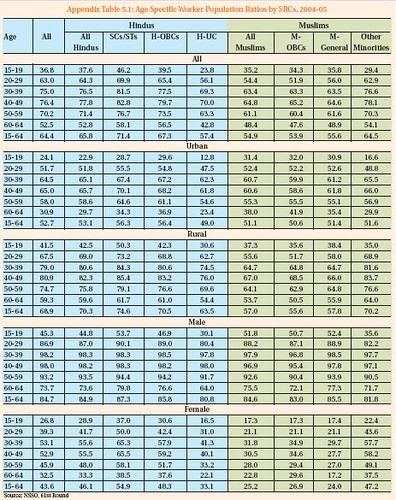
Age Specific Worker Population Ratios by SRCs, 2004-05
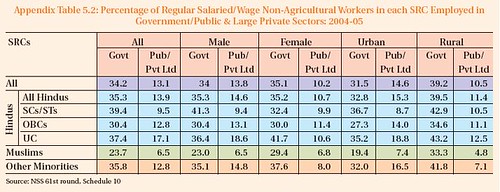
Percentage of Regular Salaried/Wage Non-Agricultural Workers in each SRC Employed in Government/Public & Large Private Sectors: 2004-05
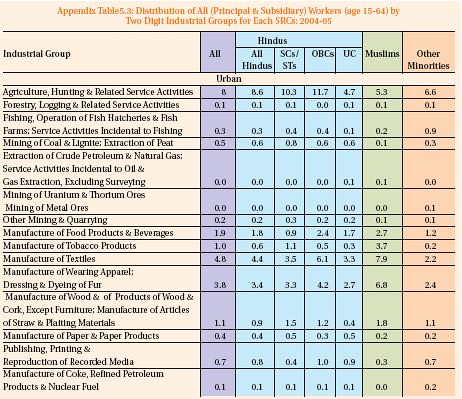
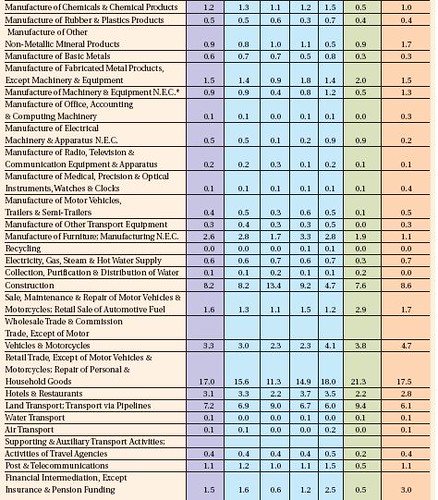
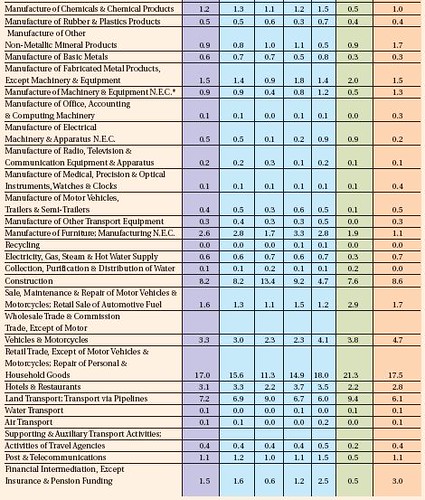
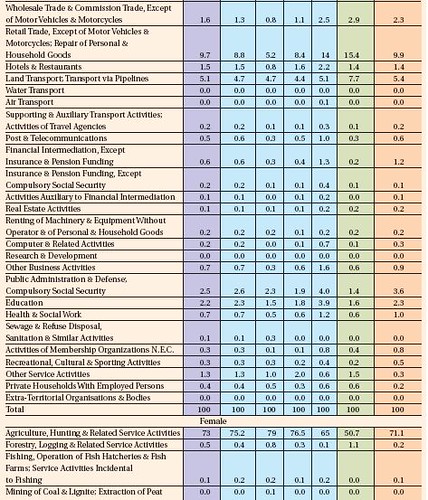
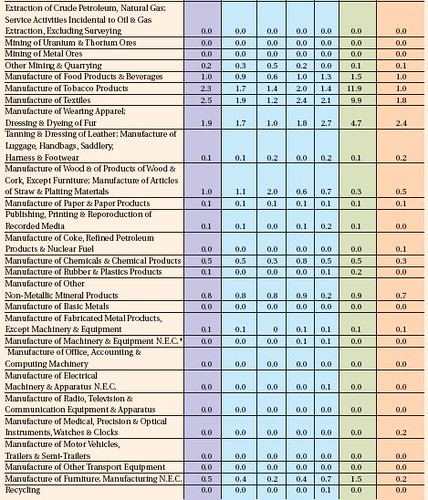
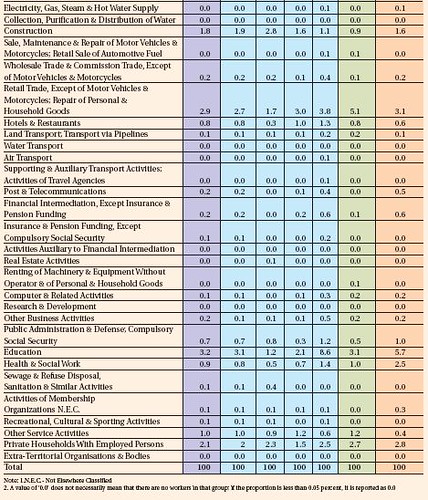
Distribution of All (Principal & Subsidiary) Workers (age 15-64) by Two Digit Industrial Groups for Each SRCs: 2004-05
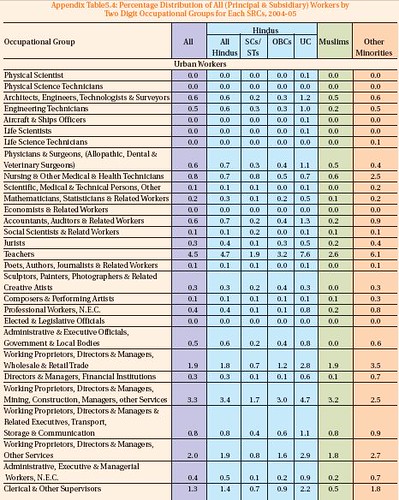
Percentage Distribution of All (Principal & Subsidiary) Workers by Two Digit Occupational Groups for Each SRCs, 2004-05
Worker Population Rates in Each State by SRCs, All Workers, 2004-05

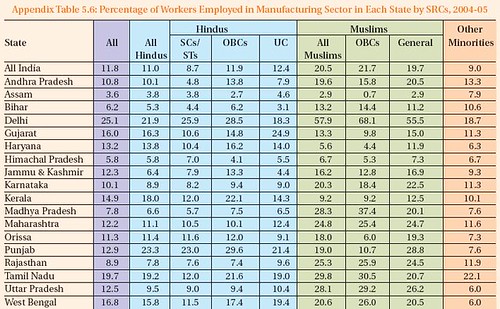
Percentage of Workers Employed in Manufacturing Sector in Each State by SRCs, 2004-05
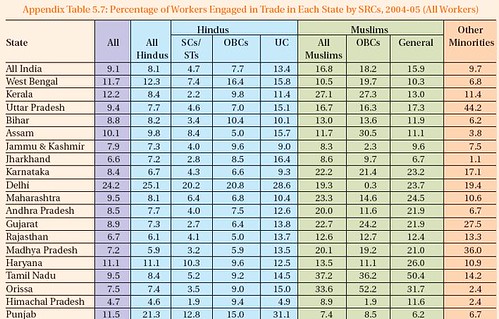
Percentage of Workers Engaged in Trade in Each State by SRCs, 2004-05 (All Workers)
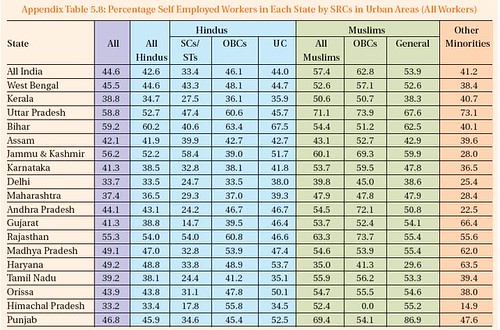
Percentage Self Employed Workers in Each State by SRCs in Urban Areas (All Workers)
List of Scheduled Commercial Banks

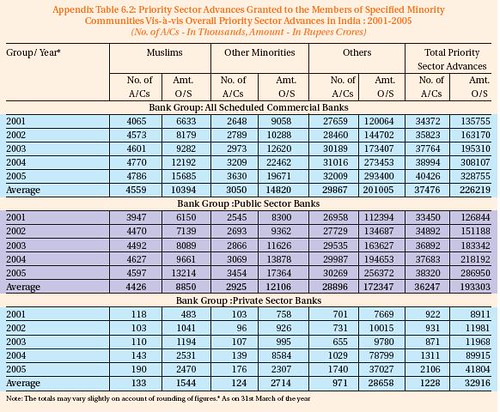
Priority Sector Advances Granted to the Members of Specified Minority Communities Vis-à-vis Overall Priority Sector Advances in India : 2001-2005 (No. of A/Cs – In Thousands, Amount – In Rupees Crores)
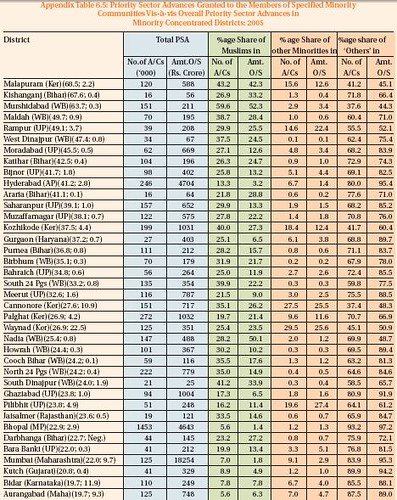
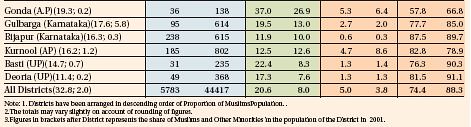
Priority Sector Advances Granted to the Members of Specified Minority Communities Vis-à-vis Overall Priority Sector Advances in Minority Concentrated Districts: 2005
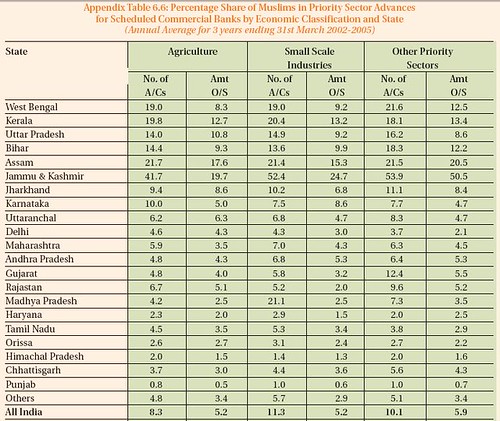
Percentage Share of Muslims in Priority Sector Advances for Scheduled Commercial Banks by Economic Classification and State (Annual Average for 3 years ending 31st March 2002-2005)
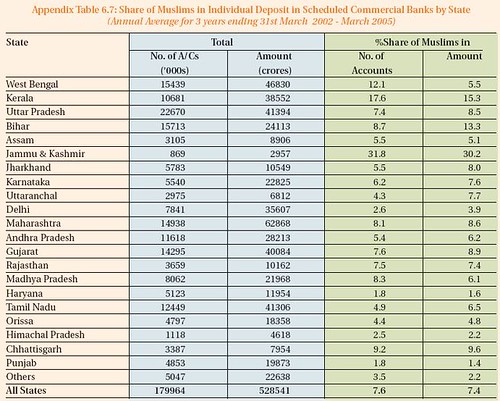
Share of Muslims in Individual Deposit in Scheduled Commercial Banks by State (Annual Average for 3 years ending 31st March 2002 – March 2005)
Individual Deposit per Account in Scheduled Commercial Banks by State (Annual Average for 3 years ending 31st March 2002-2005, in Rupees)
Benefits Accruing to Muslim under Programmes Implemented by SIDBI : 2000-01 to 2005-06
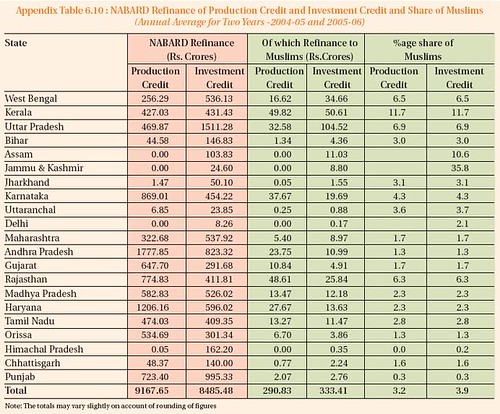
NABARD Refinance of Production Credit and Investment Credit and Share of Muslims (Annual Average for Two Years -2004-05 and 2005-06)
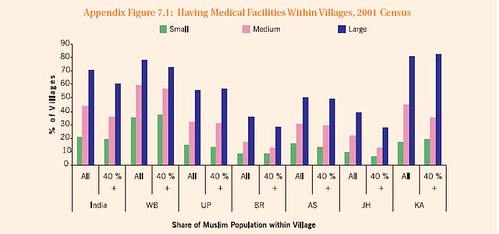
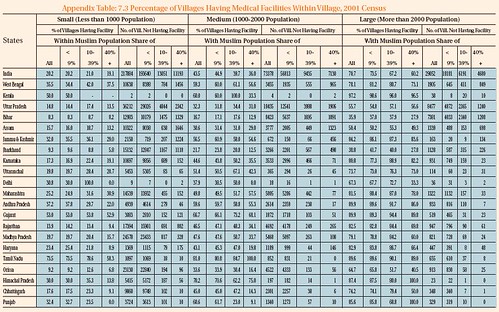
Having Medical Facilities Within Villages, 2001 Census
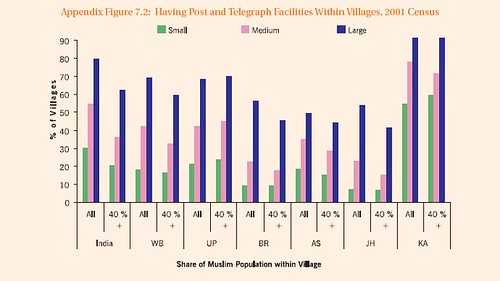
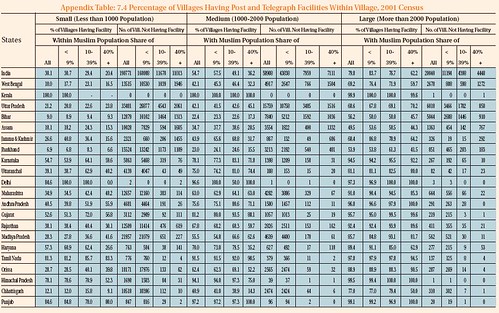
Having Post and Telegraph Facilities Within Villages, 2001 Census
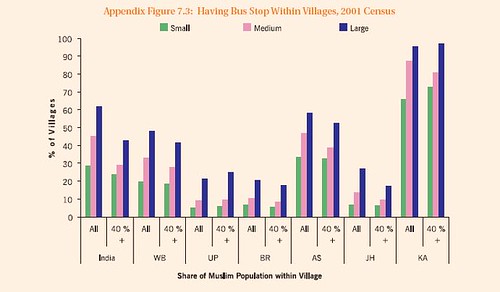
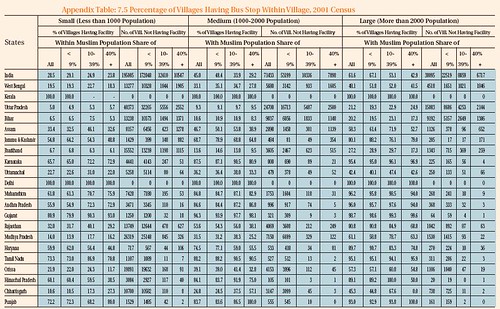
Having Bus Stop Within Villages, 2001 Census
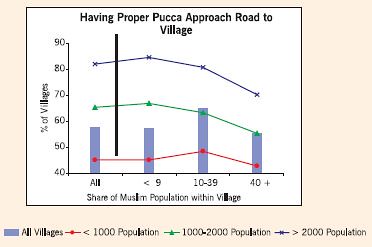
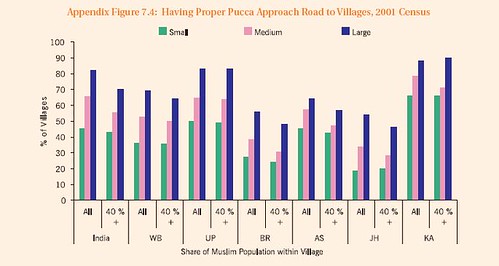
Having Proper Pucca Approach Road to Villages, 2001 Census
Number of Villages without Basic Facilities
Percentage of Villages Having Educational Institutions Within Village, 2001 Census
Percentage of Villages Having Medical Facilities Within Village, 2001 Census
Percentage of Villages Having Post and Telegraph Facilities Within Village, 2001 Census
Percentage of Villages Having Bus Stop Within Village, 2001 Census
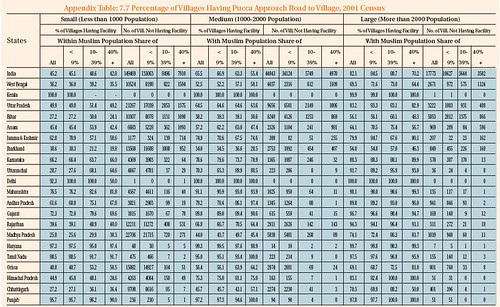
Percentage of Villages Having Pucca Approach Road to Village, 2001 Census
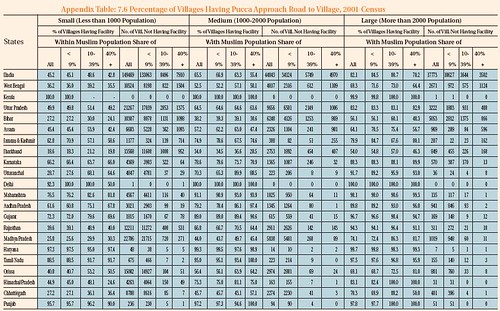
Percentage of Villages Having Pucca Approach Road to Village, 2001 Census
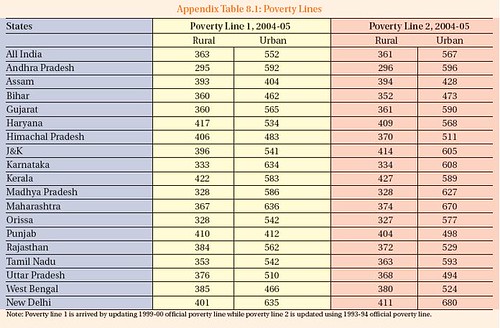
Poverty Lines
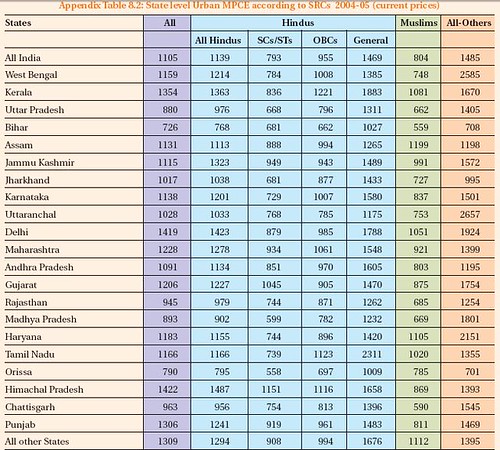
State level Urban MPCE according to SRCs 2004-05 (current prices)
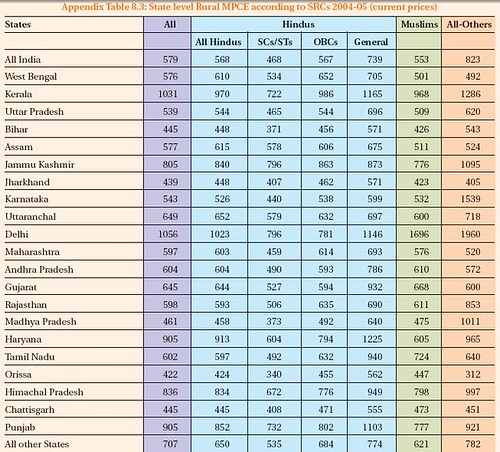
State level Rural MPCE according to SRCs 2004-05 (current prices)
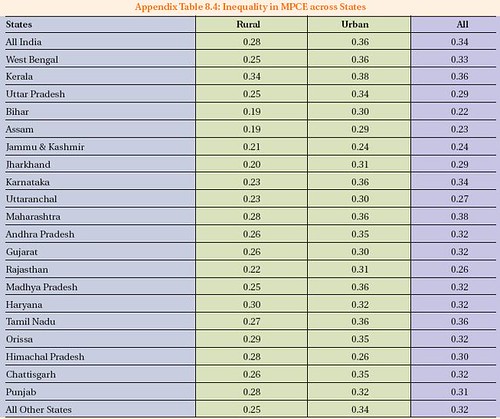
Inequality in MPCE across States
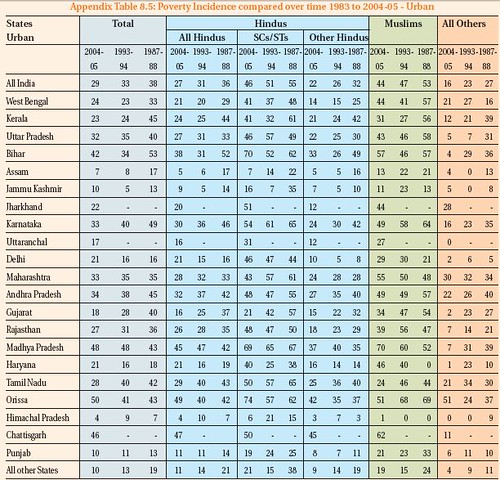
Poverty Incidence compared over time 1983 to 2004-05 – Urban
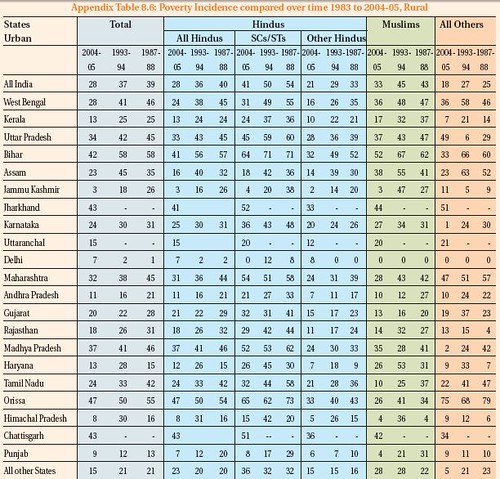
Poverty Incidence compared over time 1983 to 2004-05, Rural
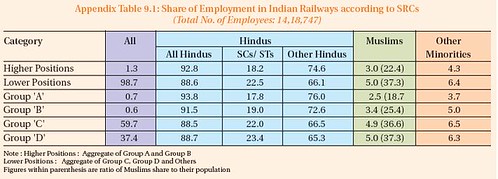
Share of Employment in Indian Railways according to SRCs (Total No. of Employees: 14,18,747)
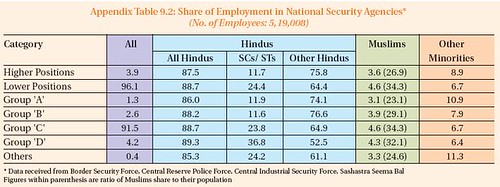
Share of Employment in National Security Agencies* (No. of Employees: 5,19,008)
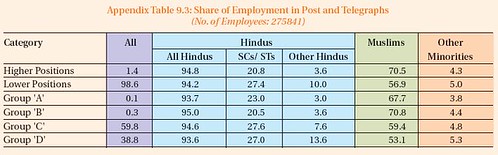
Share of Employment in Post and Telegraphs (No. of Employees: 275841)
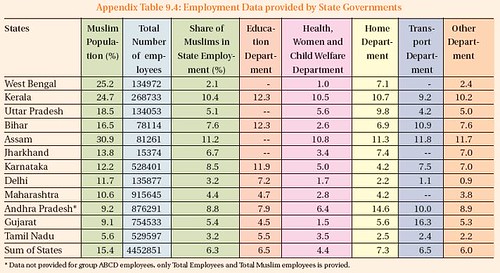
Employment Data provided by State Governments
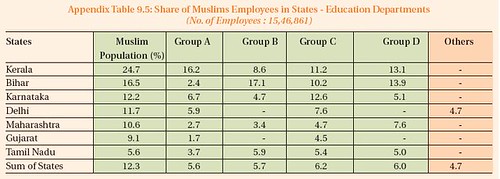
Share of Muslims Employees in States – Education Departments (No. of Employees : 15,46,861)
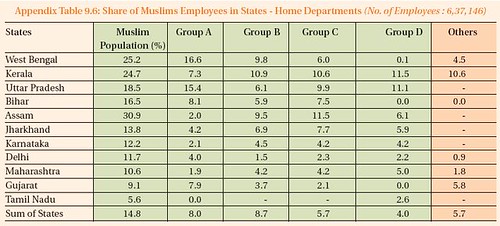
Share of Muslims Employees in States – Home Departments (No. of Employees : 6,37,146)
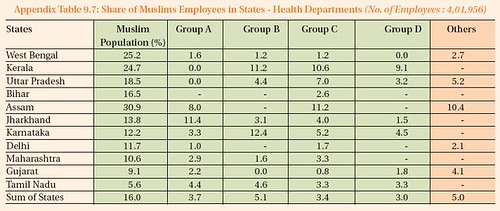
Share of Muslims Employees in States – Health Departments (No. of Employees : 4,01,956)
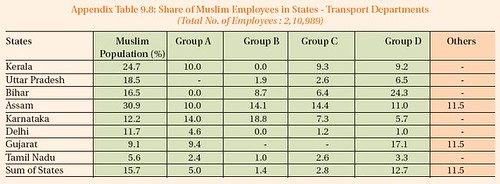
Share of Muslim Employees in States – Transport Departments (Total No. of Employees : 2,10,989)
Share of Muslim Employees in All Other Departments in Selected States (No. of Employees : 15,95,349)
Share of Muslim Employees in Judiciary (No. of Employees: 98593)
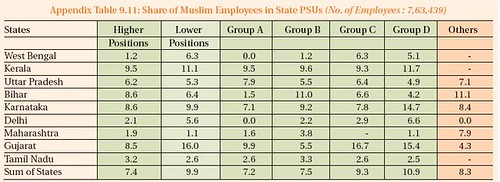
Share of Muslim Employees in State PSUs (No. of Employees : 7,63,439)
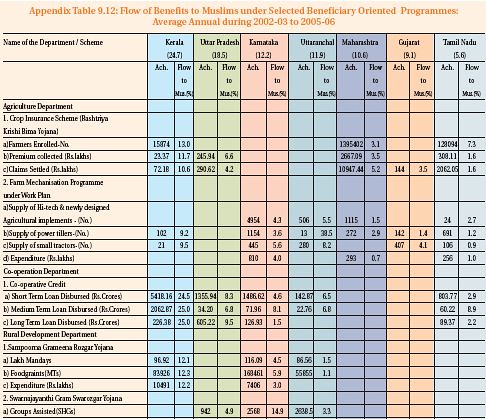
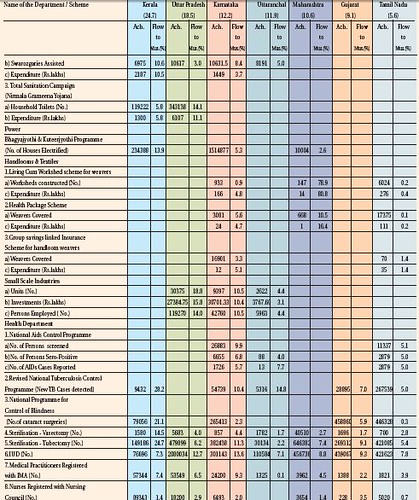
Flow of Benefits to Muslims under Selected Beneficiary Oriented Programmes: Average Annual during 2002-03 to 2005-06

Share of Muslims in Amount Disbursed by NMDFC and Beneficiaries Covered Under Term Loan Scheme : April 2002 – March 2006

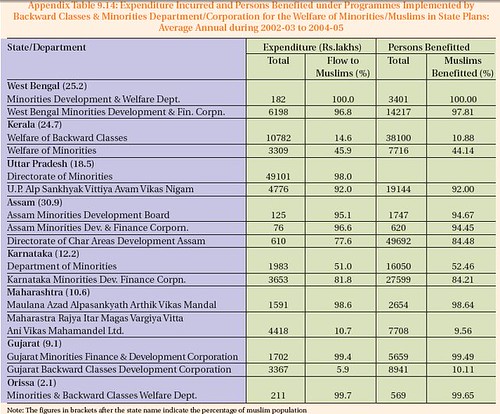
Expenditure Incurred and Persons Benefited under Programmes Implemented by Backward Classes & Minorities Department/Corporation for the Welfare of Minorities/Muslims in State Plans: Average Annual during 2002-03 to 2004-05
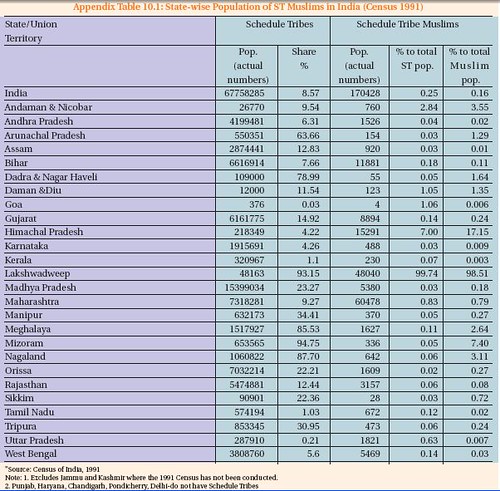
State-wise Population of ST Muslims in India (Census 1991)
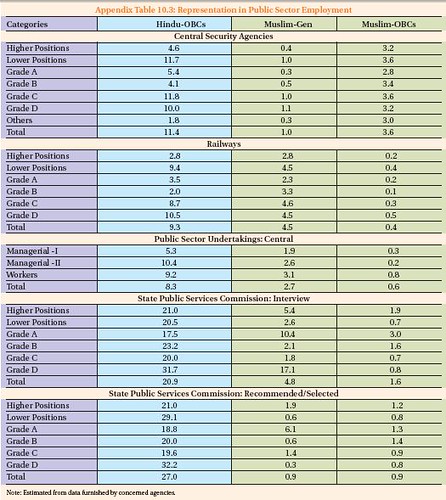
Representation in Public Sector Employment
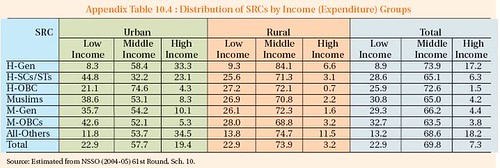
Distribution of SRCs by Income (Expenditure) Groups
Source: Sachar report
Data related to Indian Muslim from Arjun Sengupta Commission Report
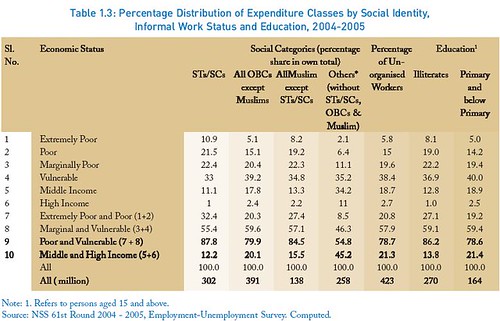
Percentage Distribution of Expenditure Classes by Social Identity, Informal Work Status and Education, 2004-2005
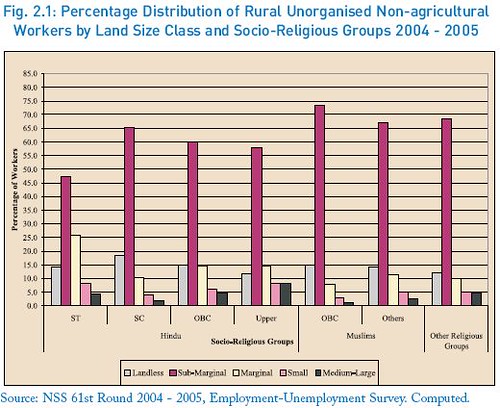
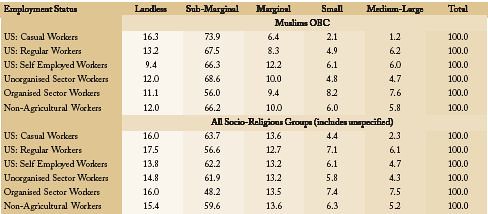
Percentage Distribution of Rural Unorganised Non-agricultural Workers by Land Size Class and Socio-Religious Groups 2004 – 2005
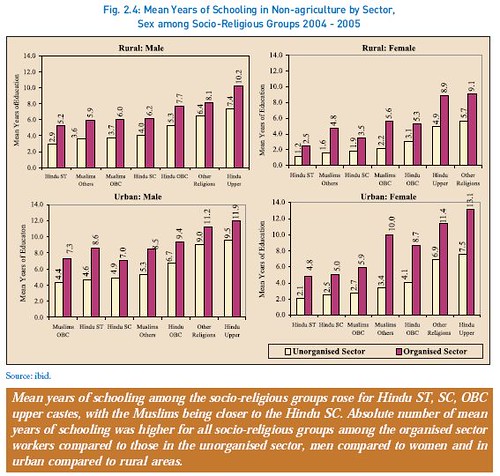
Mean Years of Schooling in Non-agriculture by Sector, Sex among Socio-Religious Groups 2004 – 2005
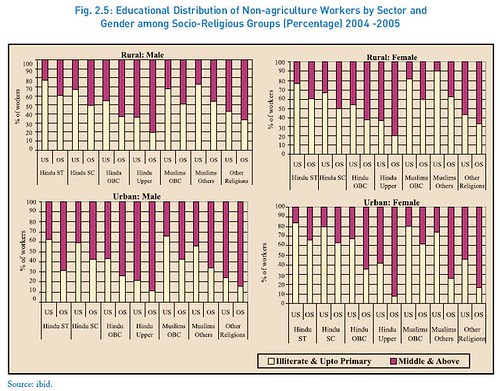
Educational Distribution of Non-agriculture Workers by Sector and Gender among Socio-Religious Groups (Percentage) 2004 -2005
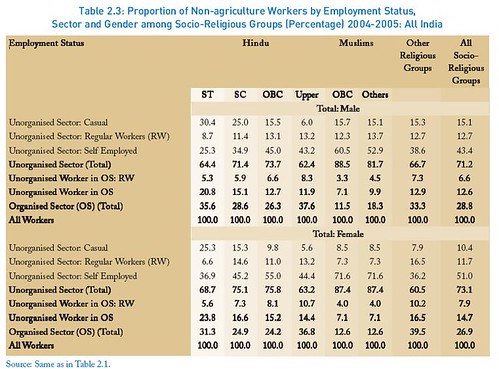
Proportion of Non-agriculture Workers by Employment Status, Sector and Gender among Socio-Religious Groups (Percentage) 2004-2005: All India
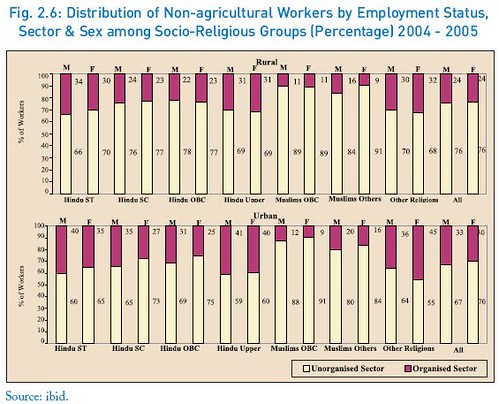
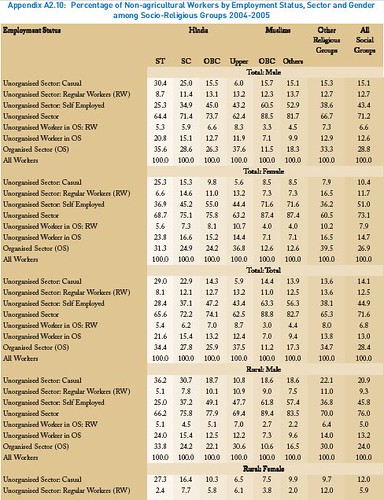
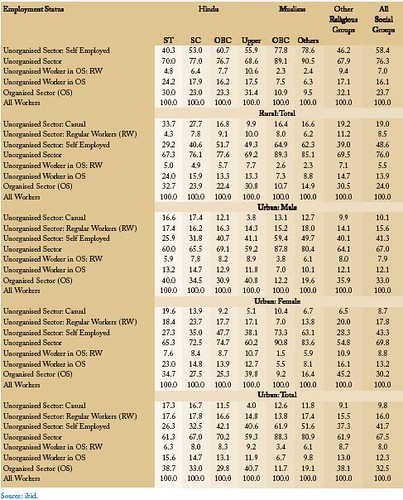
Distribution of Non-agricultural Workers by Employment Status, Sector & Sex among Socio-Religious Groups (Percentage) 2004 – 2005
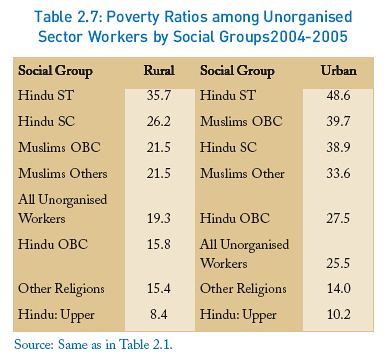
Poverty Ratios among Unorganised Sector Workers by Social Groups2004-2005
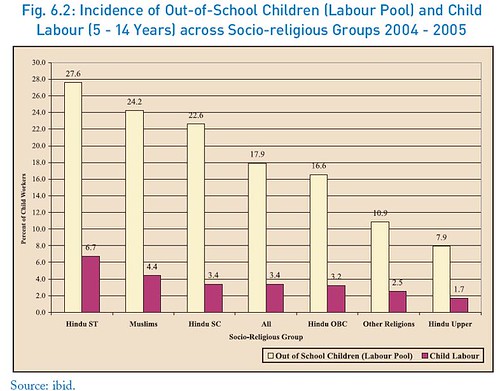
Incidence of Out-of-School Children (Labour Pool) and Child Labour (5 – 14 Years) across Socio-religious Groups 2004 – 2005
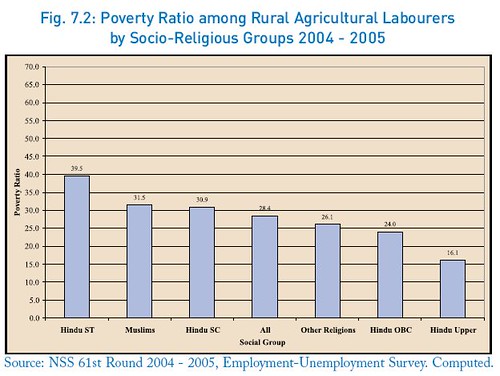
Poverty Ratio among Rural Agricultural Labourers by Socio-Religious Groups 2004 – 2005
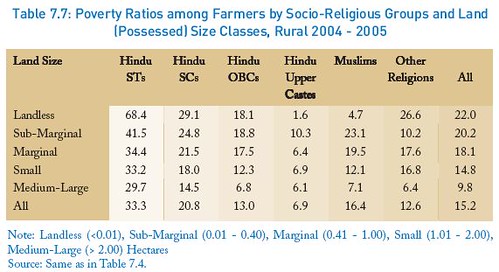
Poverty Ratios among Farmers by Socio-Religious Groups and Land (Possessed) Size Classes, Rural 2004 – 2005
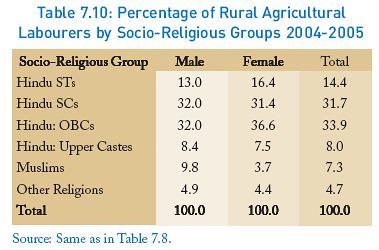
Percentage of Rural Agricultural Labourers by Socio-Religious Groups 2004-2005
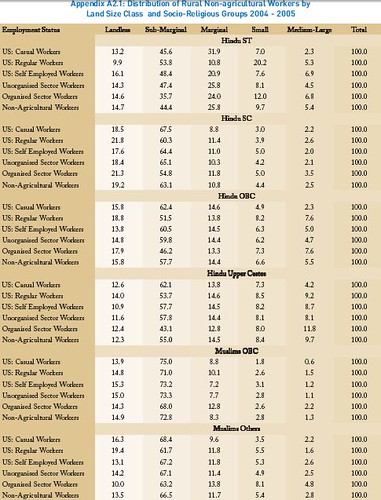
Distribution of Rural Non-agricultural Workers by Land Size Class and Socio-Religious Groups 2004 – 2005
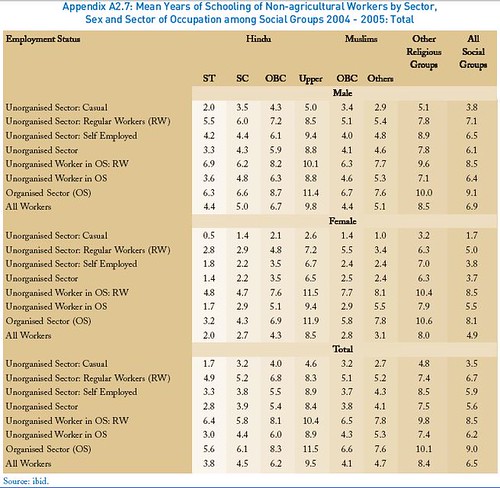
Mean Years of Schooling of Non-agricultural Workers by Sector, Sex and Sector of Occupation among Social Groups 2004 – 2005: Total
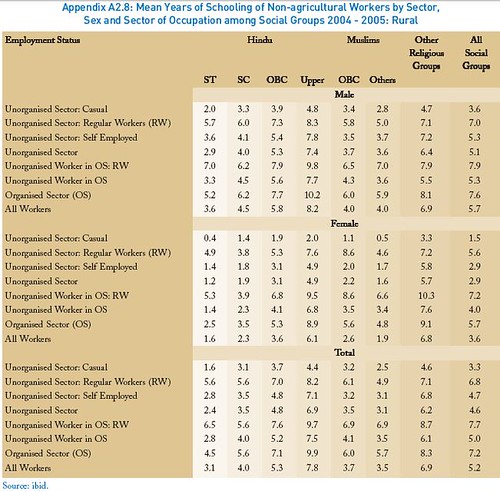
Mean Years of Schooling of Non-agricultural Workers by Sector, Sex and Sector of Occupation among Social Groups 2004 – 2005: Rural
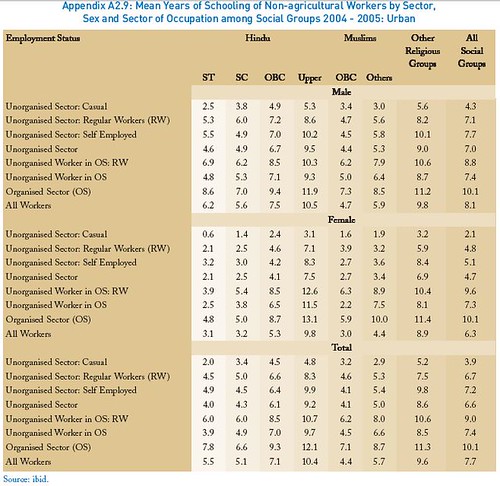
Mean Years of Schooling of Non-agricultural Workers by Sector, Sex and Sector of Occupation among Social Groups 2004 – 2005: Urban
Percentage of Non-agricultural Workers by Employment Status, Sector and Gender among Socio-Religious Groups 2004-2005
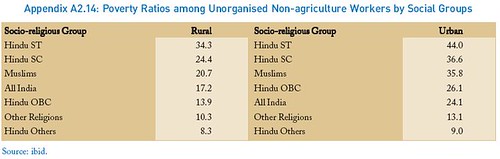
Poverty Ratios among Unorganised Non-agriculture Workers by Social Groups
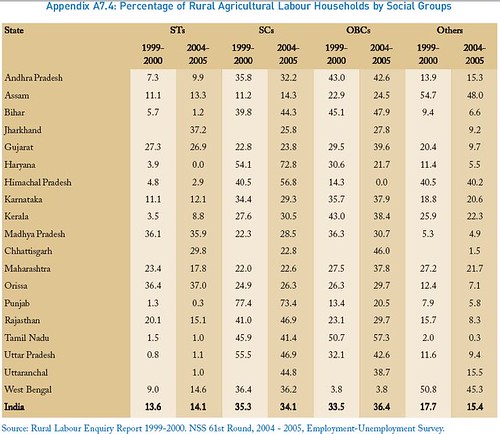
Percentage of Rural Agricultural Labour Households by Social Groups
Source: Arjun Sengupta Commission Report
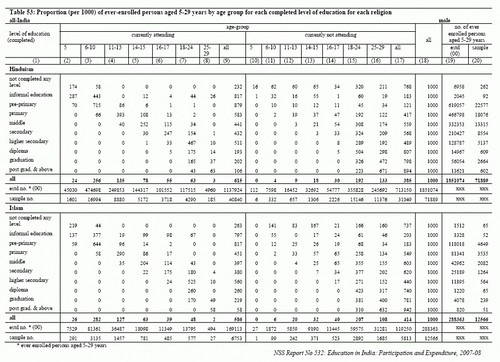
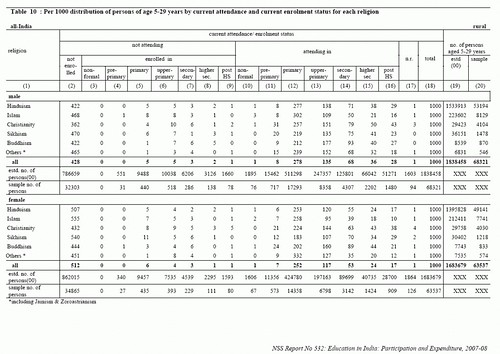
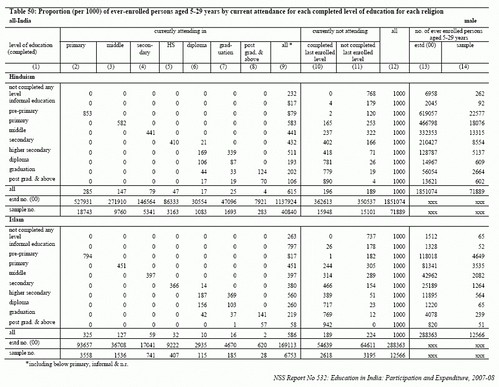
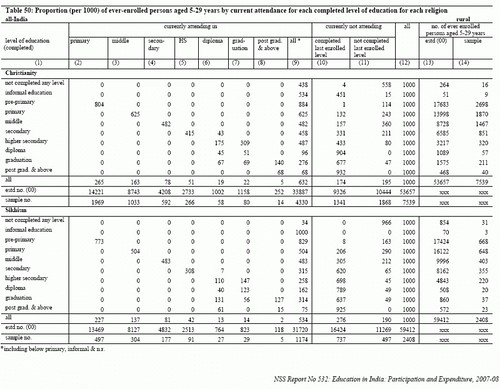
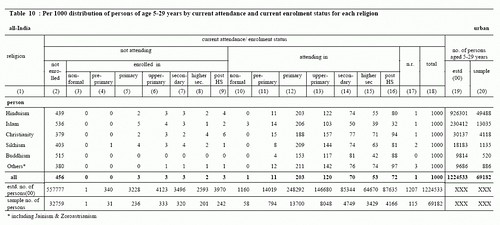
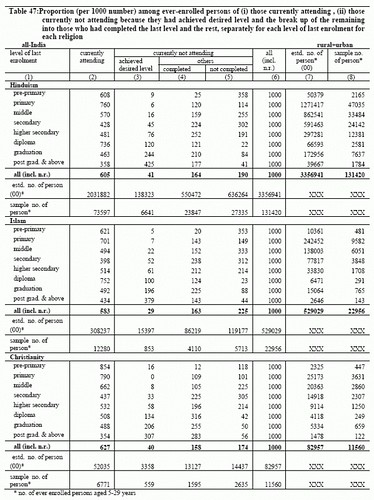
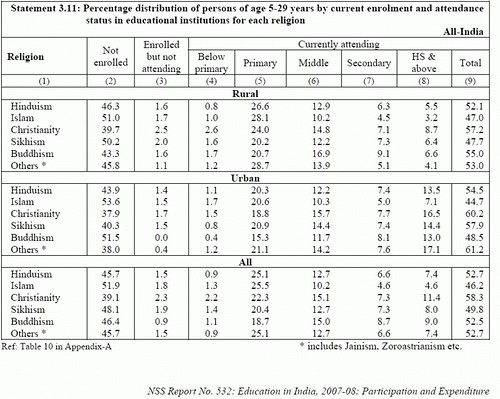
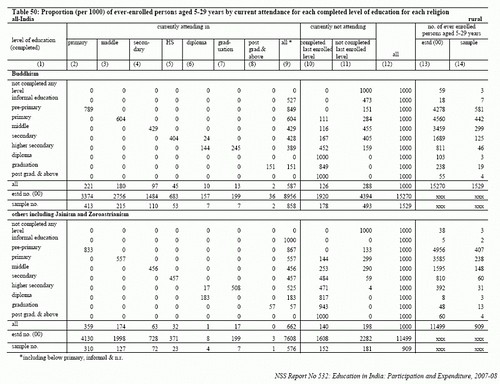
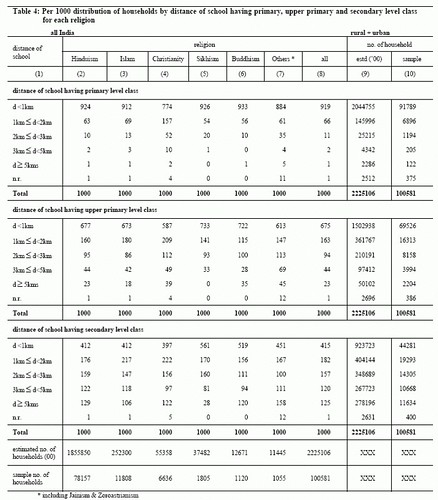
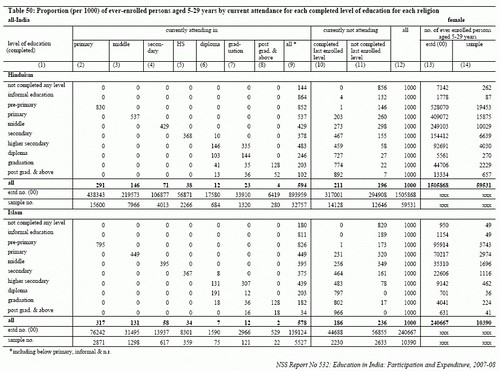
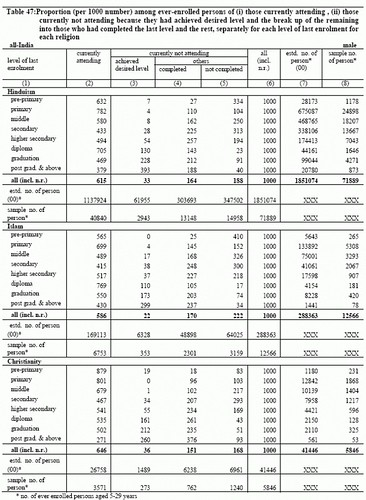
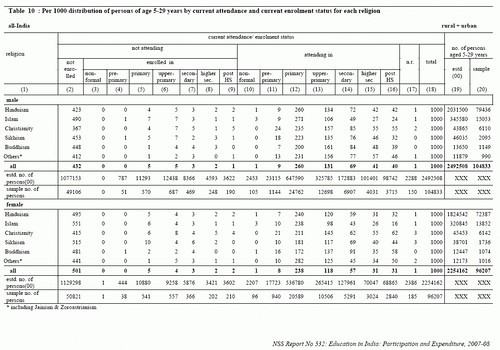
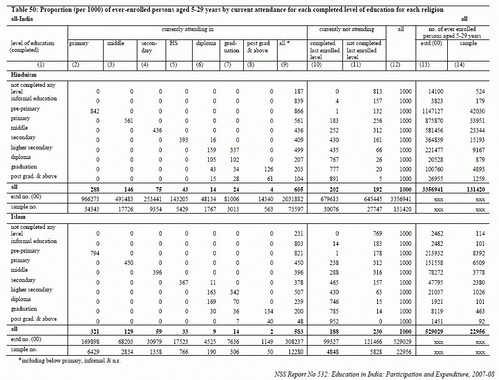
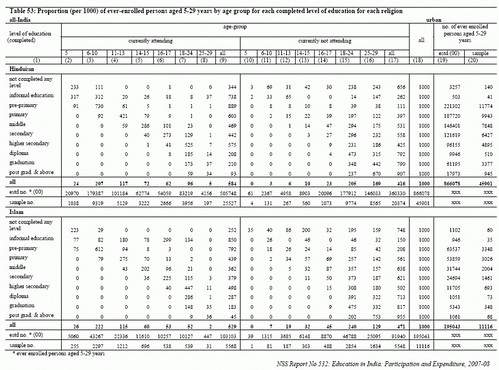
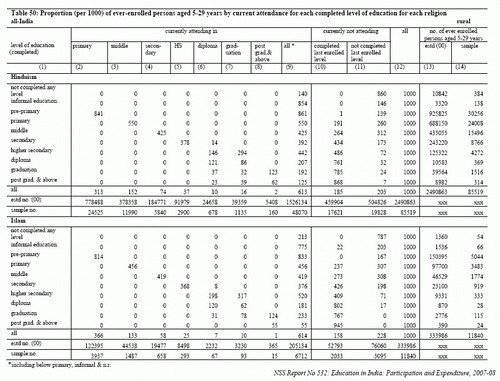
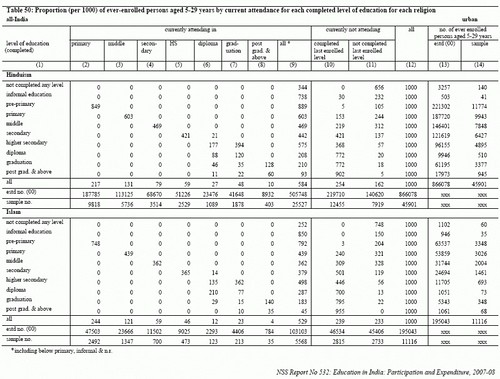
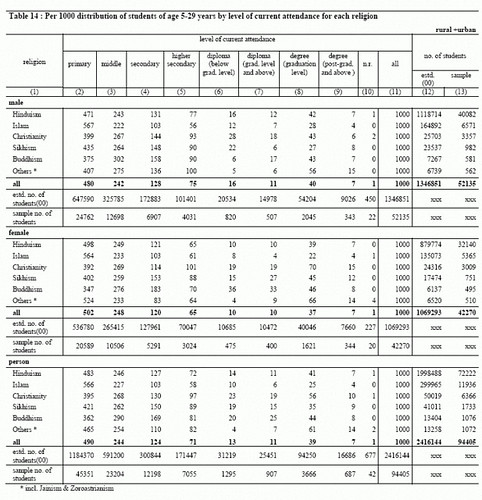
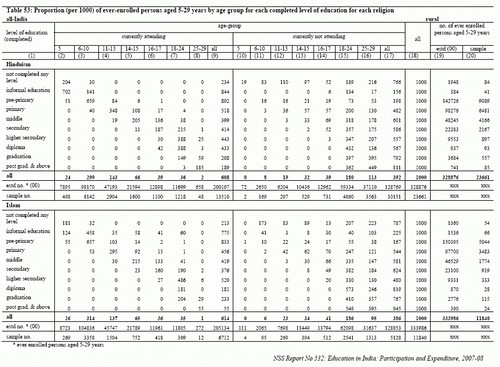
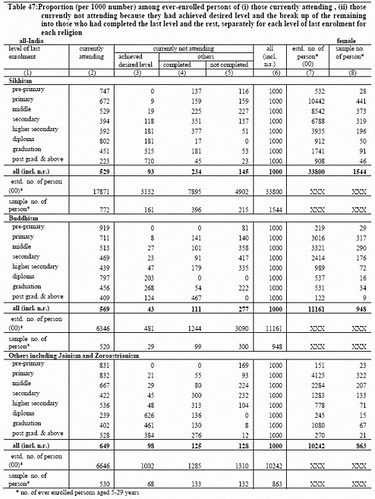
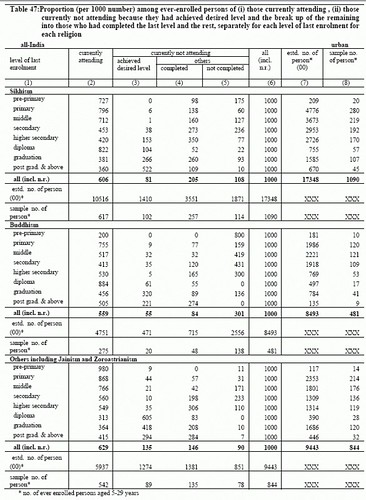
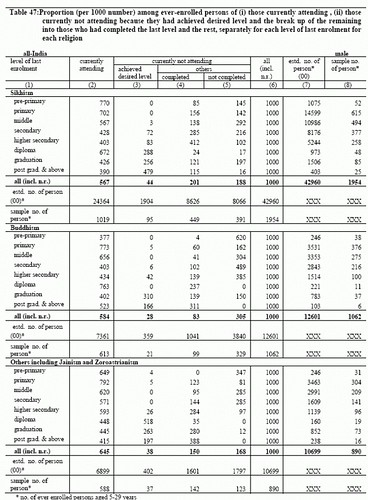
Education in India, 2007-08: Participation and Expenditure
Per 1000 distribution of age 5-29 by current attendance and current enrolment status [rural male+ rural female]
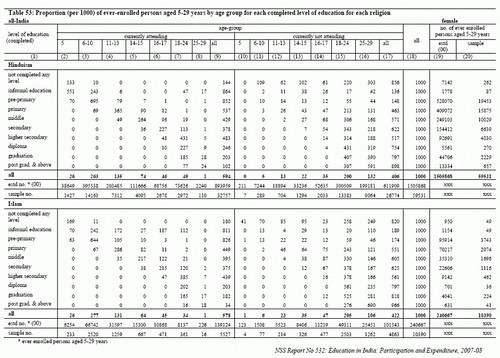
Per 1000 of ever-enrolled age 5-29 by current attendance for each completed level of education [male]
Per 1000 of ever-enrolled age 5-29 by for each completed level of education [rural] – part II
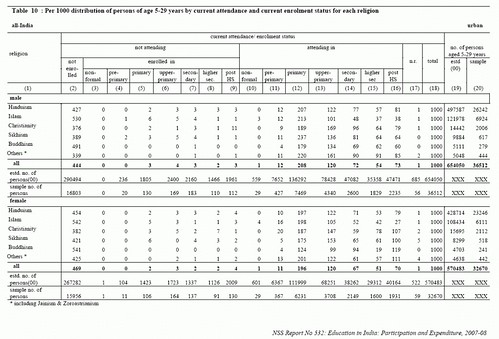
Per 1000 distribution of age 5-29 by current attendance and current enrolment status [urban all]
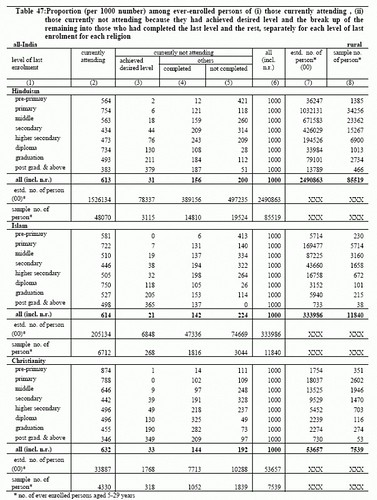
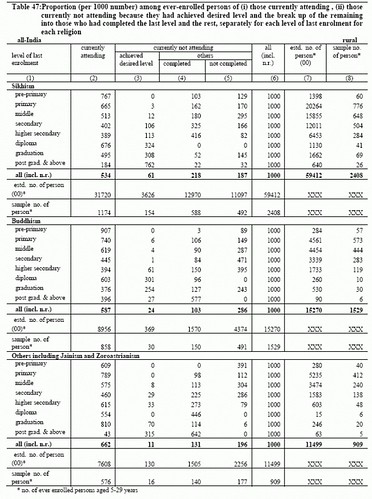
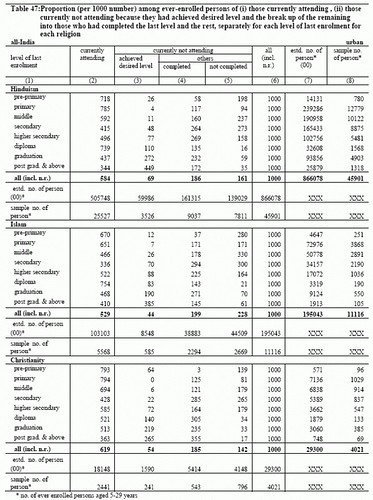
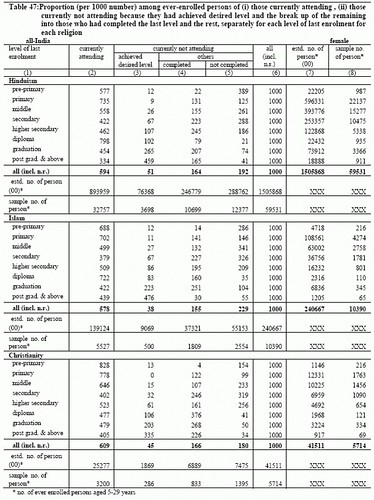
Ever enrolled and completed [rural+urban]
% distribution of age 5-29 years by current enrolment and attendance status in educational institutions.
Per 1000 of ever-enrolled age 5-29 by current attendance for each completed level of education [rural] -part II
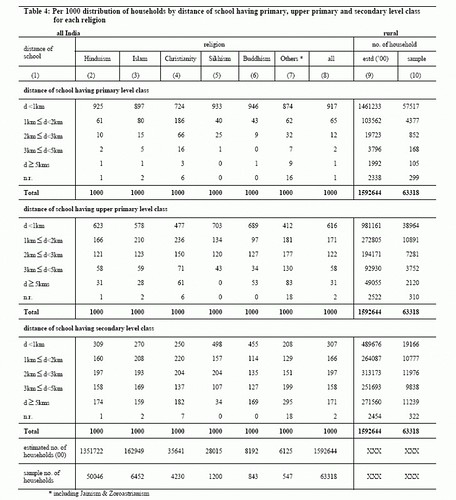
Per 1000 distribution of households by distance of school. [rural+urban]
Per 1000 distribution of age 5-29 by current attendance and current enrolment status [urban male+ urban female]
Ever enrolled and completed [rural]
Per 1000 distribution of households by distance of school. [rural]
ever enrolled and completed [rural] – part II
ever enrolled and completed [urban]
Per 1000 of ever-enrolled age 5-29 by for each completed level of education [female]
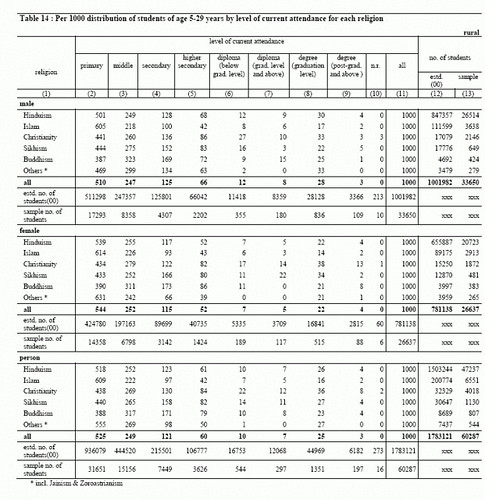
Per 1000 distribution of age 5-29 by level of current attendance [rural male+ rural female]
ever enrolled and completed [female] -part I
Per 1000 distribution of households by distance of school. [urban]

Per 1000 of ever-enrolled age 5-29 by current attendance for each completed level of education [female]
Per 1000 of ever-enrolled age 5-29 by for each completed level of education [rural+urban]

ever enrolled and completed [male] -part I
Per 1000 distribution of age 5-29 by current attendance and current enrolment status [rural +urban]
Per 1000 of ever-enrolled age 5-29 by current attendance for each completed level of education [all India]
Per 1000 of ever-enrolled age 5-29 by for each completed level of education [urban]
Per 1000 of ever-enrolled age 5-29 by current attendance for each completed level of education [rural]
Per 1000 of ever-enrolled age 5-29 by current attendance for each completed level of education [urban]
Per 1000 distribution of age 5-29 by level of current attendance [rural +urban]
Per 1000 of ever-enrolled age 5-29 by for each completed level of education [rural]
ever enrolled and completed [female] -part II
ever enrolled and completed [urban] -part II
ever enrolled and completed [male] -part II
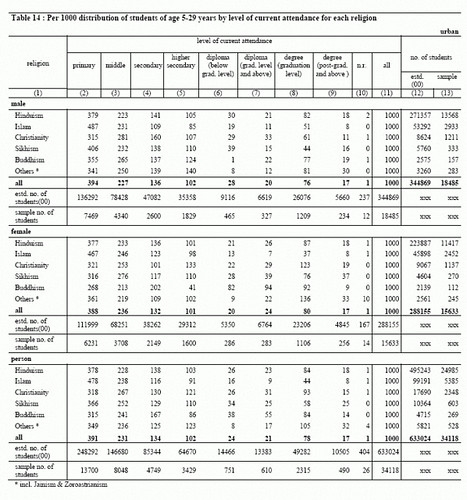
Per 1000 distribution of age 5-29 by level of current attendance [urban]
Per 1000 distribution of age 5-29 by current attendance and current enrolment status [rural all]

Per 1000 of ever-enrolled age 5-29 by for each completed level of education [male]